
Summary
As we have emphasized in recent years, we keep a close eye on fiscal policy, monetary policy, and interest rates. A lot has remained the same since our previous quarterly recap as monetary policy is still tight, fiscal policy remains nonexistent, and interest rates, although hit with a slight decline in Q1 2023, remain at historically elevated levels. Due to this, we have maintained a defensive posture across our Strategic & Tactical models as we patiently await the end of this credit tightening cycle before taking on further risk.
Major equity markets like the S&P 500, Developed International, and Emerging Markets all saw gains in Q1, with the best-performing index being International. The U.S. came in second, following close behind. This short-term outperformance from a major index, rebounding from a challenging prior year, is common.
Technology was the shining star in Q1, bouncing back after being one of the worst-performing sectors in 2022. Consumer-Discretionary was the second-best performing sector. Both outperformed the broader market altogether.
Fixed income markets rebounded slightly to start the year after historical volatility and drawdowns in 2022. Rates remain at elevated levels, and we will continue to monitor closely to determine whether adjustments are needed to extend or shorten the duration of our portfolio.
Please see below for further detailed analysis and chart references. As always, don’t hesitate to reach out if you have any questions or want to discuss anything mentioned. We appreciate your trust in us during these turbulent times.
All the best,
Syntal Investment Team
MAJOR MARKETS
Equities
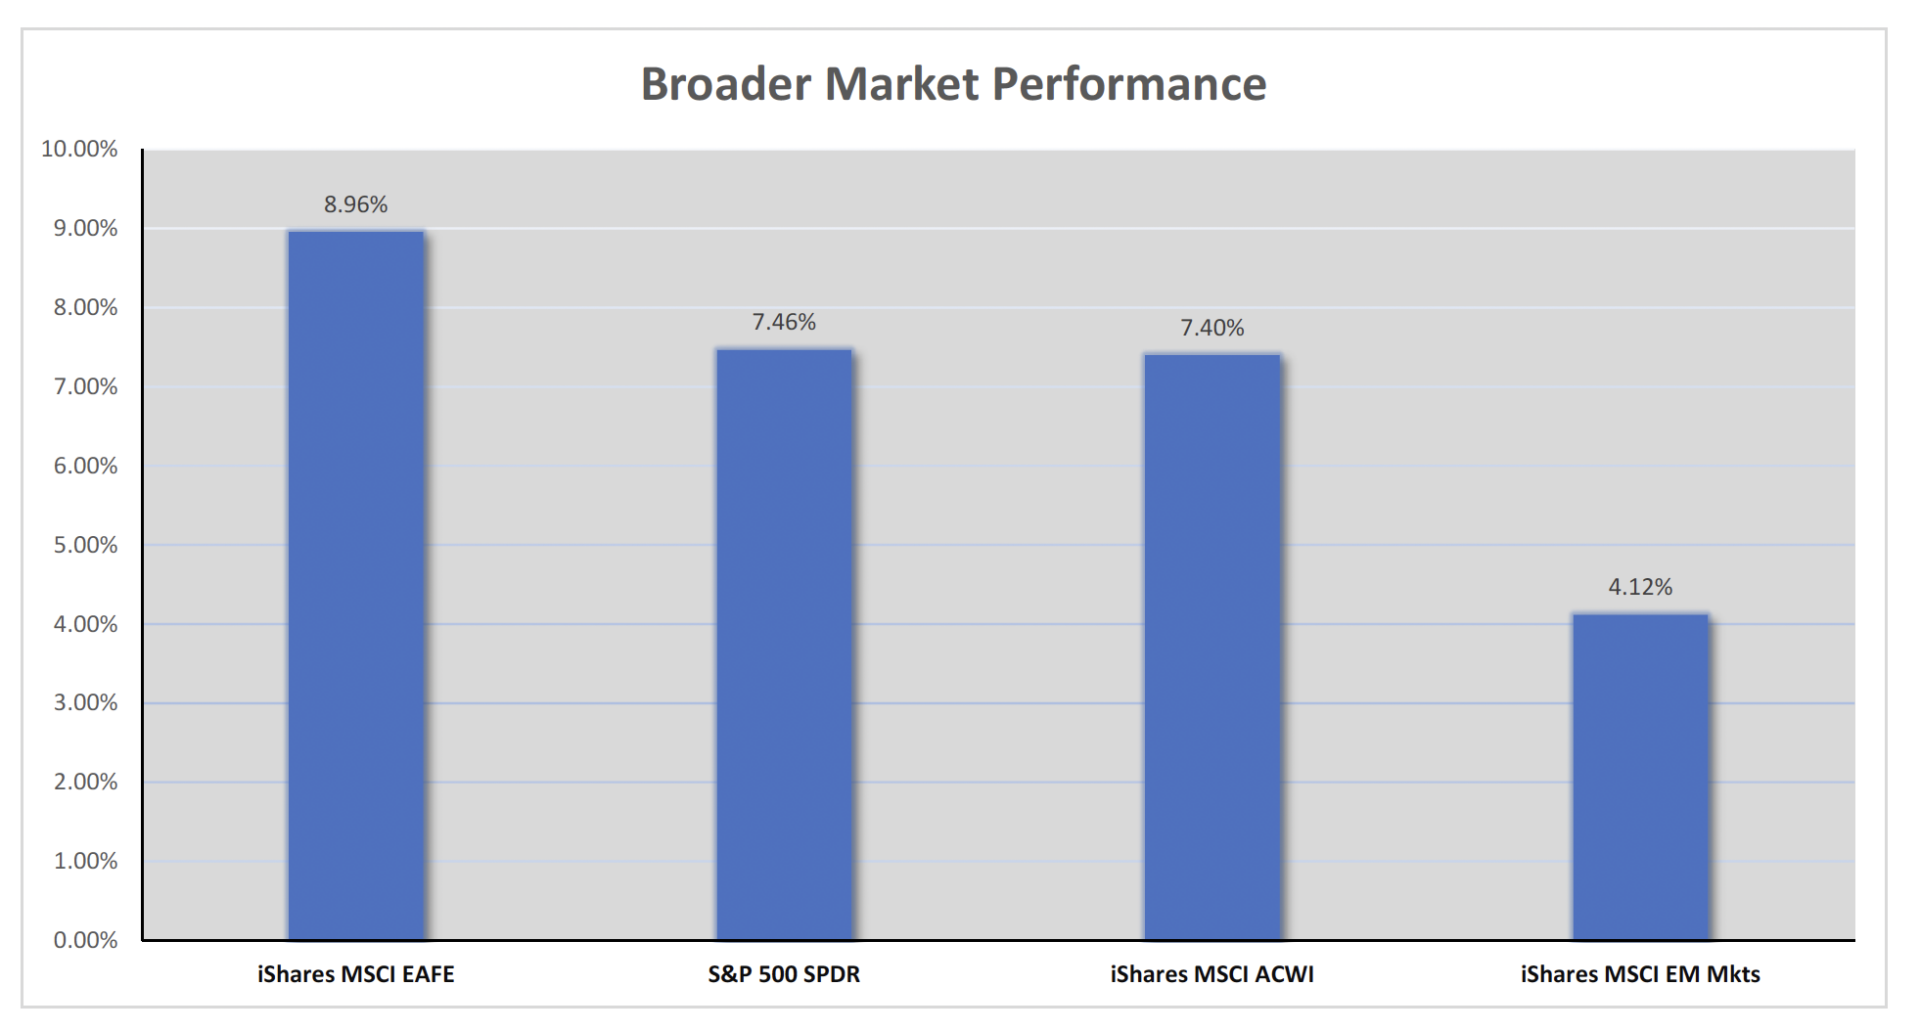
As of March 31, 2023, the best-performing equity market YTD was the MSCI EAFE international markets (8.96%), the S&P
500 US markets were second (7.46%), MSCI ACWI (7.40%) in third, and MSCI Emerging Markets (4.12%) fourth. All major
indexes were up in the first Quarter.
S&P 500 ETF (US Market) – SPY Q1

Commentary: The S&P 500 outperformed major markets in Q1 2023 with a 7.46% return, a welcome improvement after
a challenging year. However, it ranked second to the MSCI EAFE, and while lacking firm conviction, we remain cautious
due to potential volatility in the near term.
MSCI Emerging Markets ETF (Emerging Markets) – EEM Q1
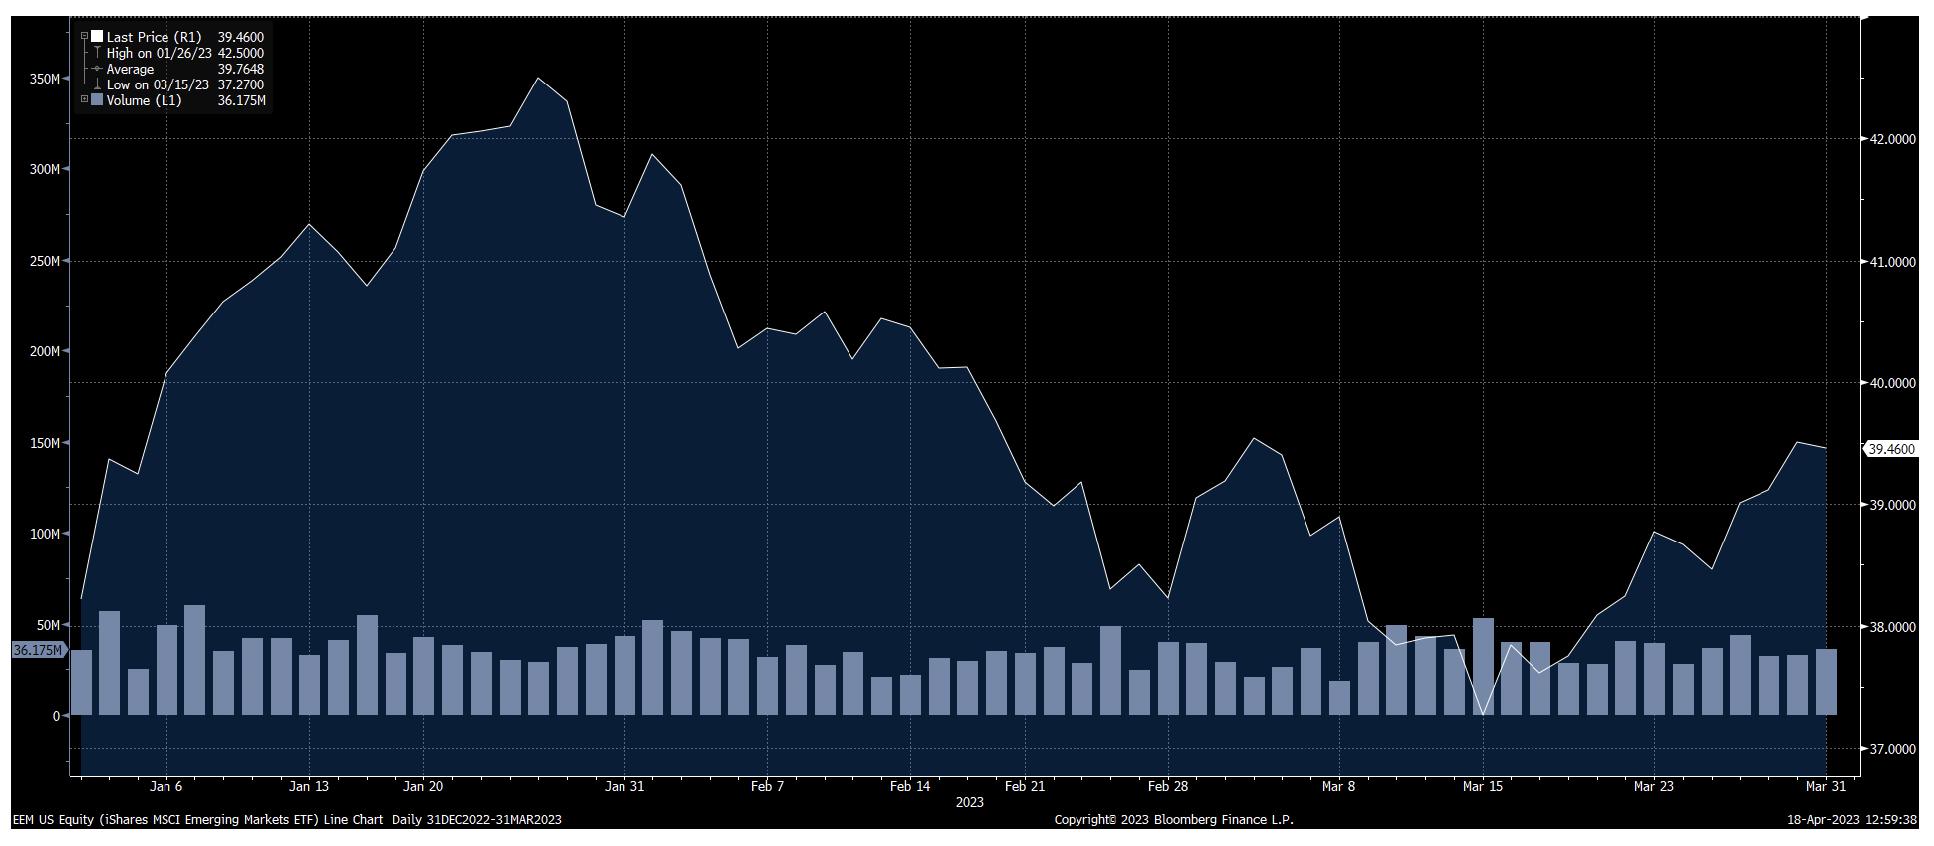
Commentary: Emerging Markets underperformed in Q1, as higher-risk assets tend to struggle in a “risk-off” market environment. China’s ongoing battle with COVID-19 also contributed to the index’s lower performance.
MSCI ACWI ETF (Global Market) – ACWI Q1
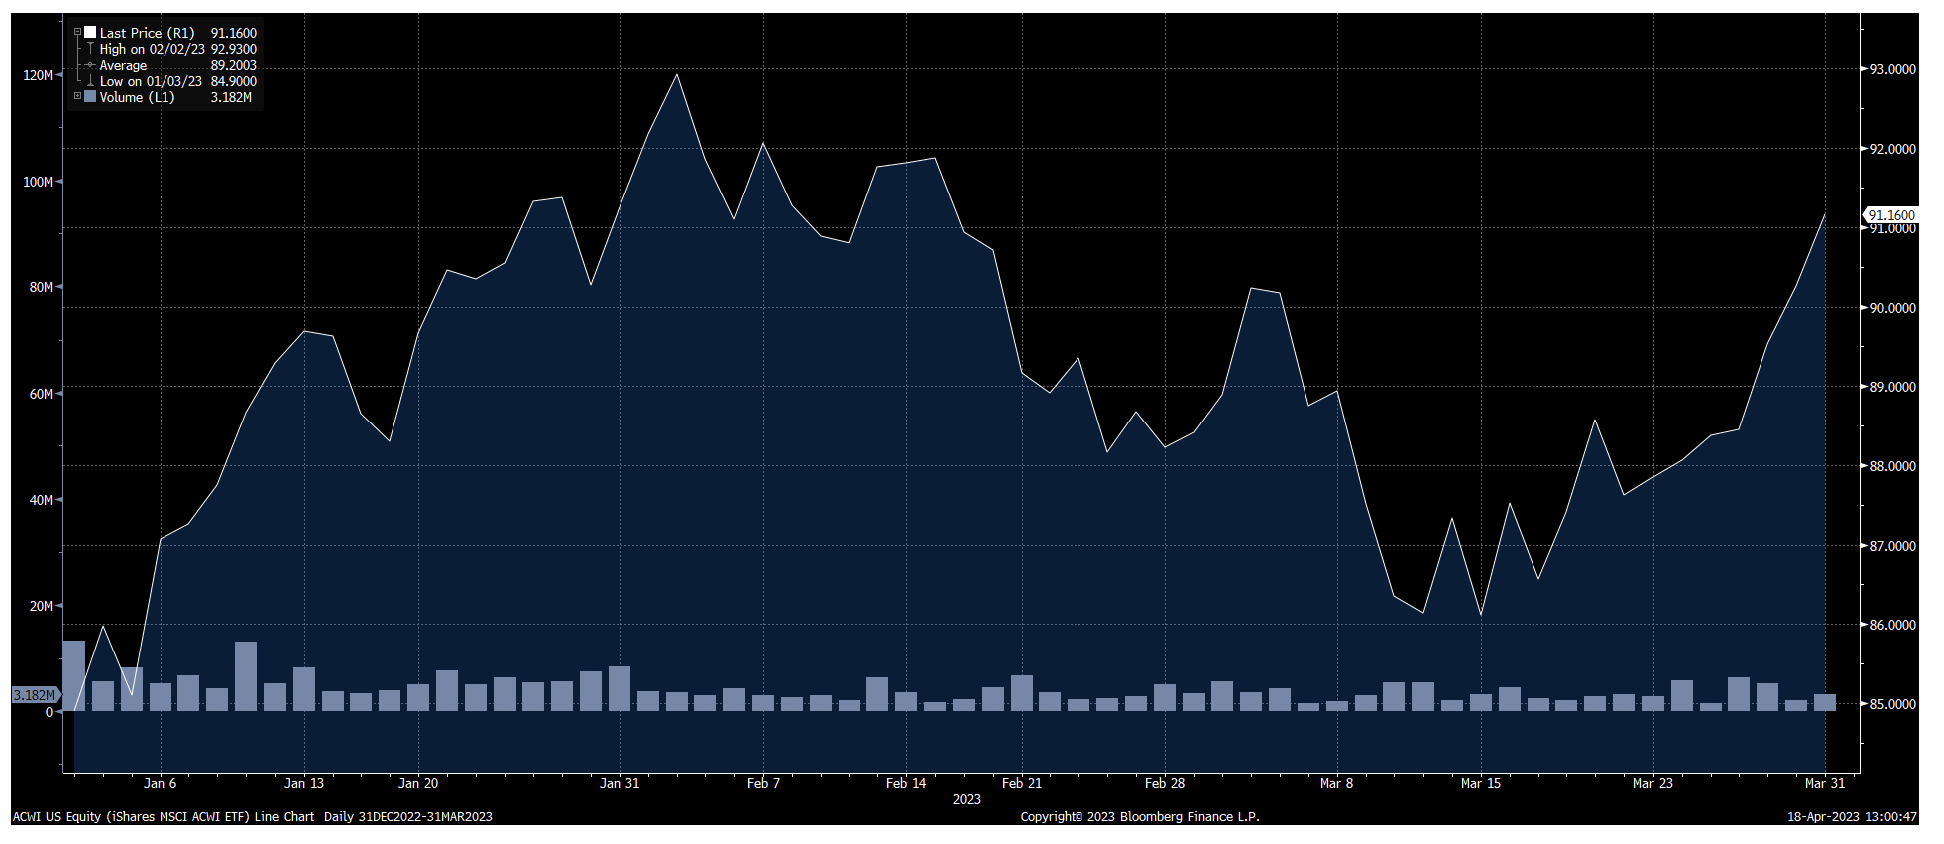
Commentary: The ACWI is a Global Market ETF that combines U.S., Developed International, and Emerging Markets. U.S. Markets are the largest piece and driver of the index; However, Developed was the best performer.
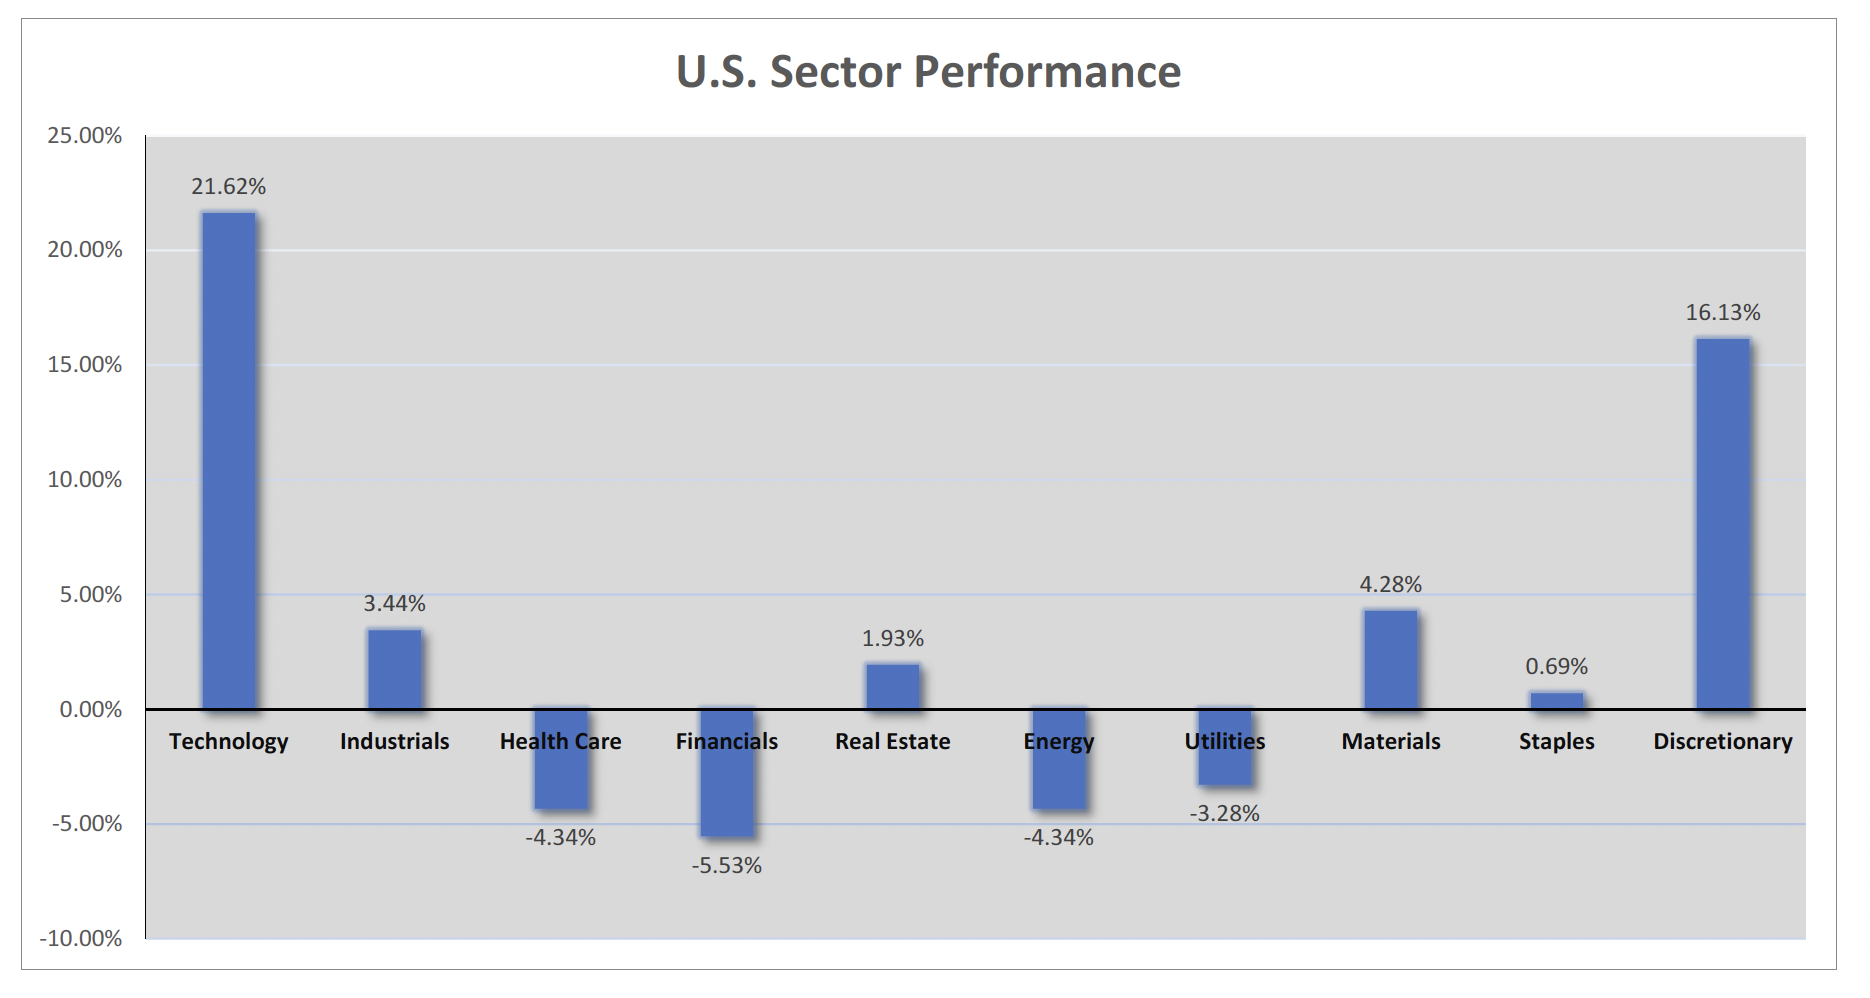
U.S. Sector Performance Q1
Technology was the best-performing U.S. sector for the 1st Quarter, with Discretionary coming in second and Materials in third. Full U.S. sector performance for the 1st Quarter is below, with Financials, Healthcare, and Energy being the worst three sectors.
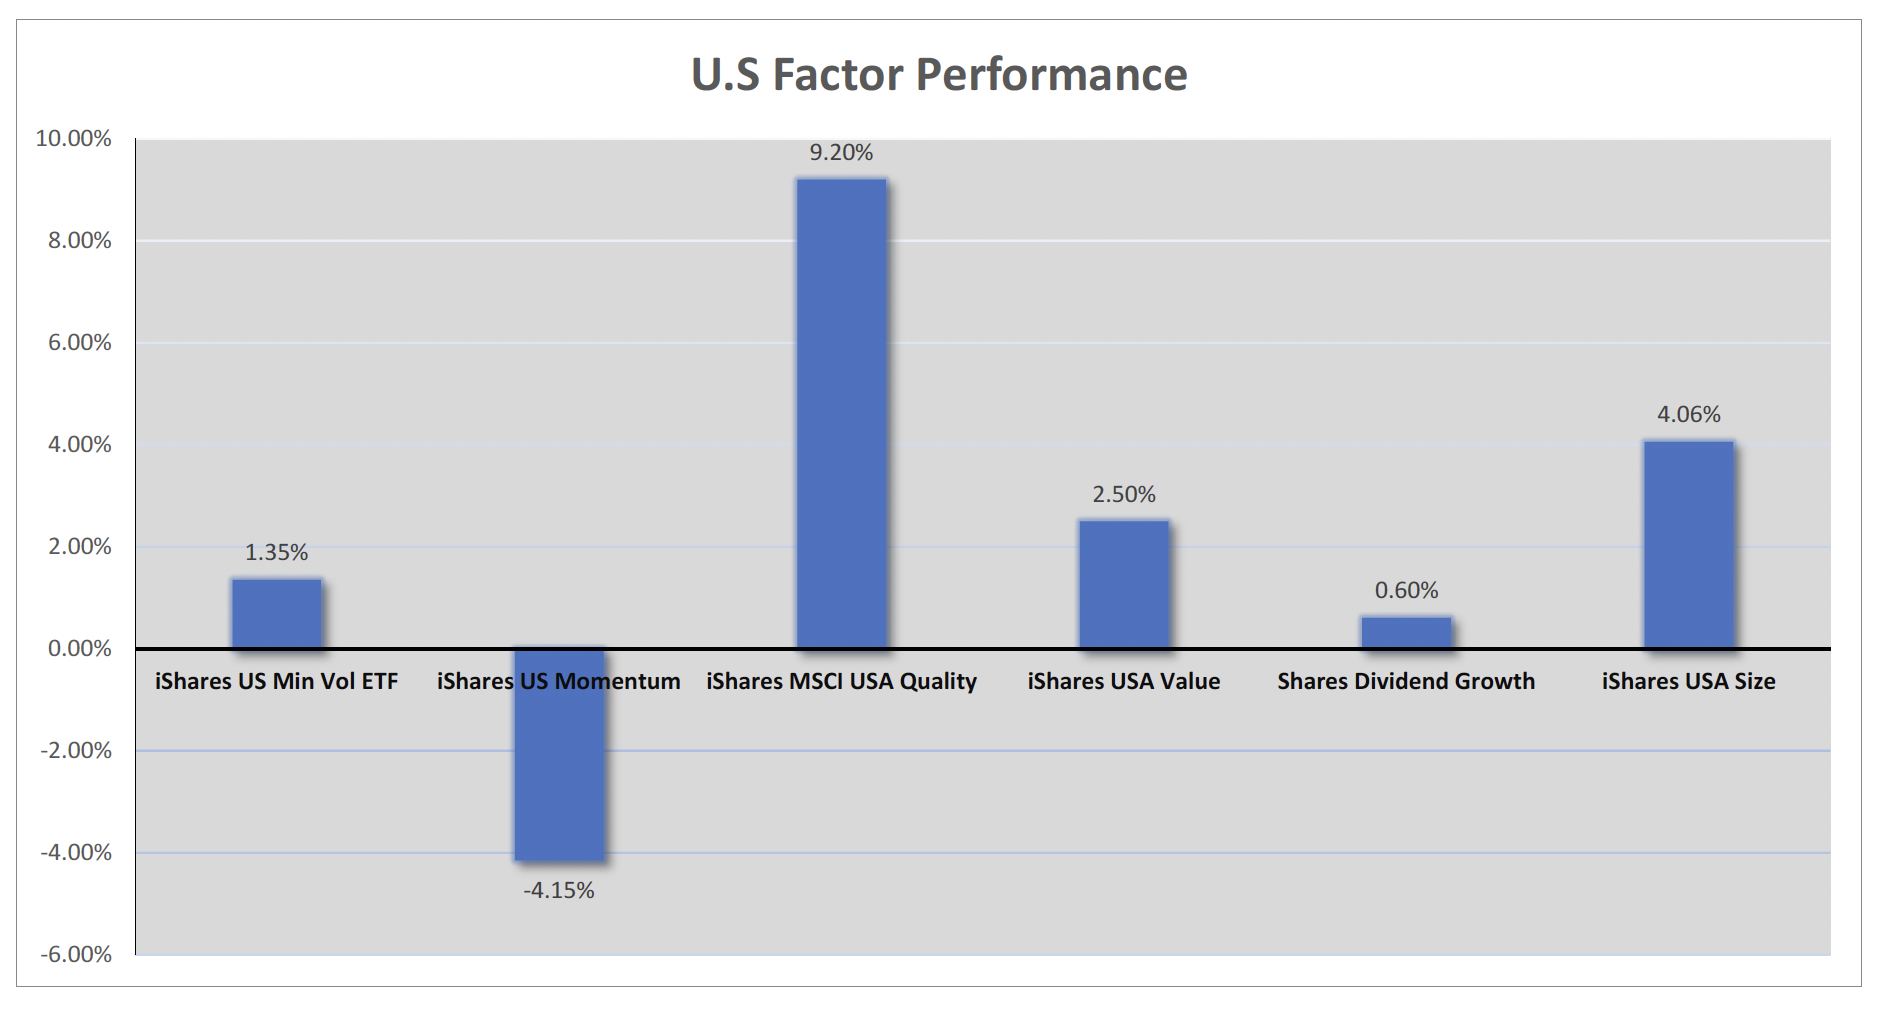
U.S. Factor Performance Q1
The best-performing factor for the 1st Quarter was Quality (QUAL), followed by Size (SIZE), lower Market Cap Stocks.
Fixed Income
iShares 20 + Years Treasury Bond (Long Term Bonds) – TLT Q1
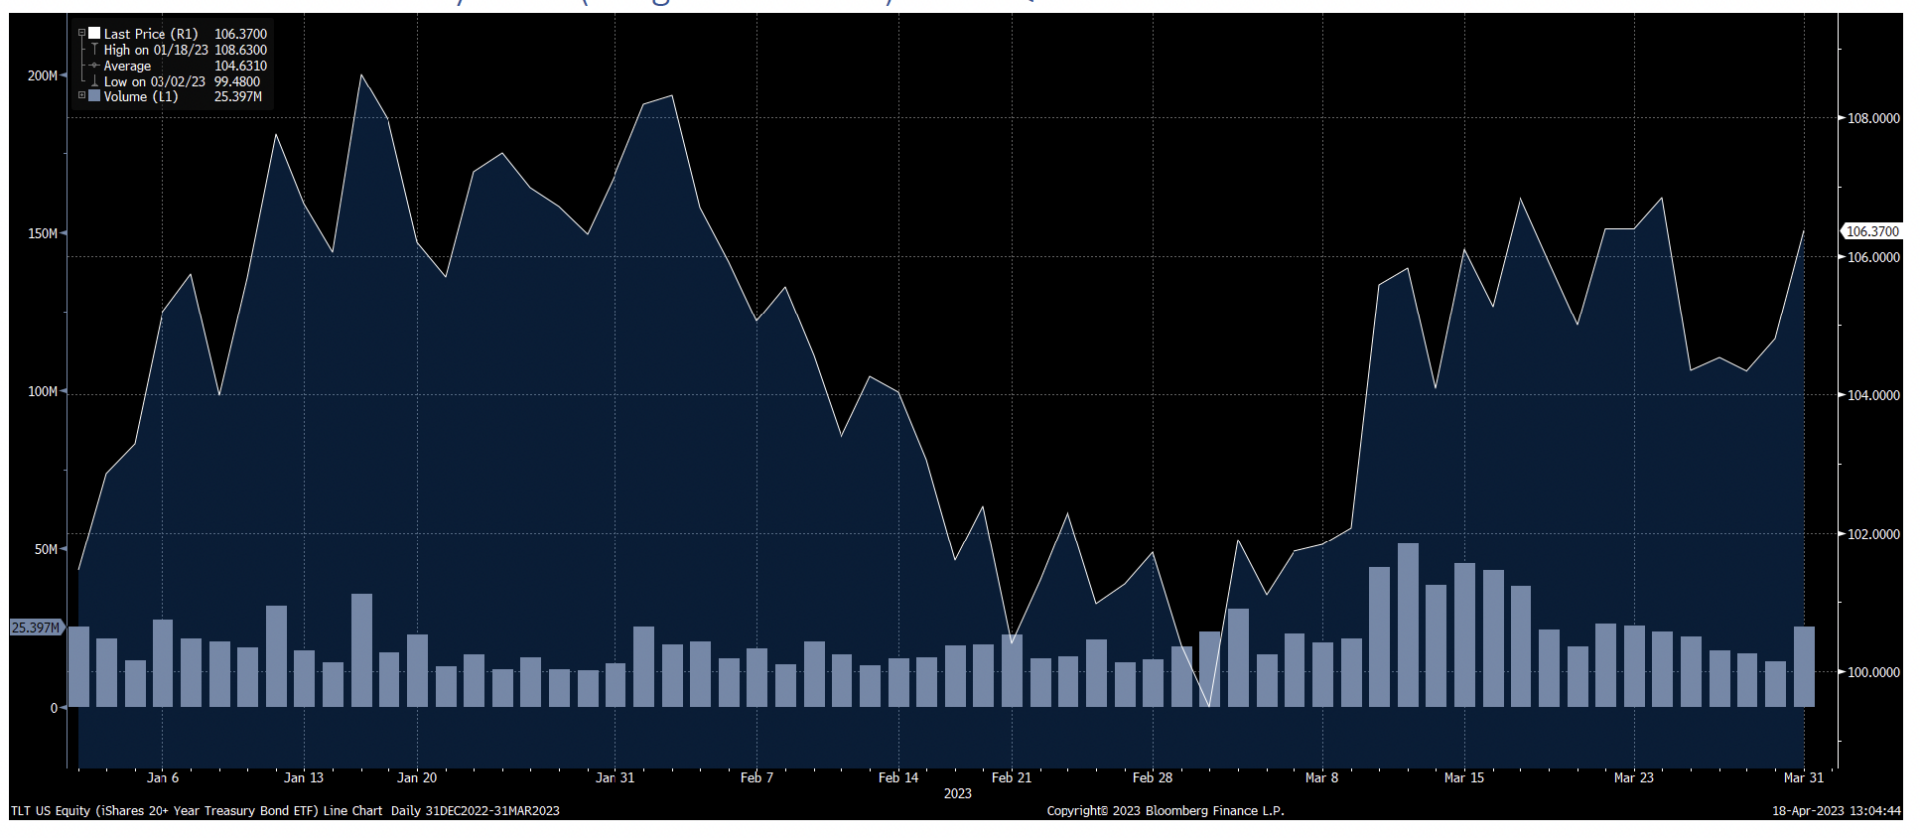
Commentary: When rates move up, the prices of bonds move down. The above chart is the longer-term treasury index, and it traded between 108 and 100 for the first Quarter. Ultimately, it is up for the Quarter, meaning rates were down.
iShares 1-3 Year Treasury Bond (Short Term Bonds) – SHY

Commentary: This is the short-term Treasury bond index. It has a duration of just under two years. As you can see from our bond charts, rates have gone down across several different maturities.
iShares National Muni Bond ETF (Municipal Bonds) – MUB
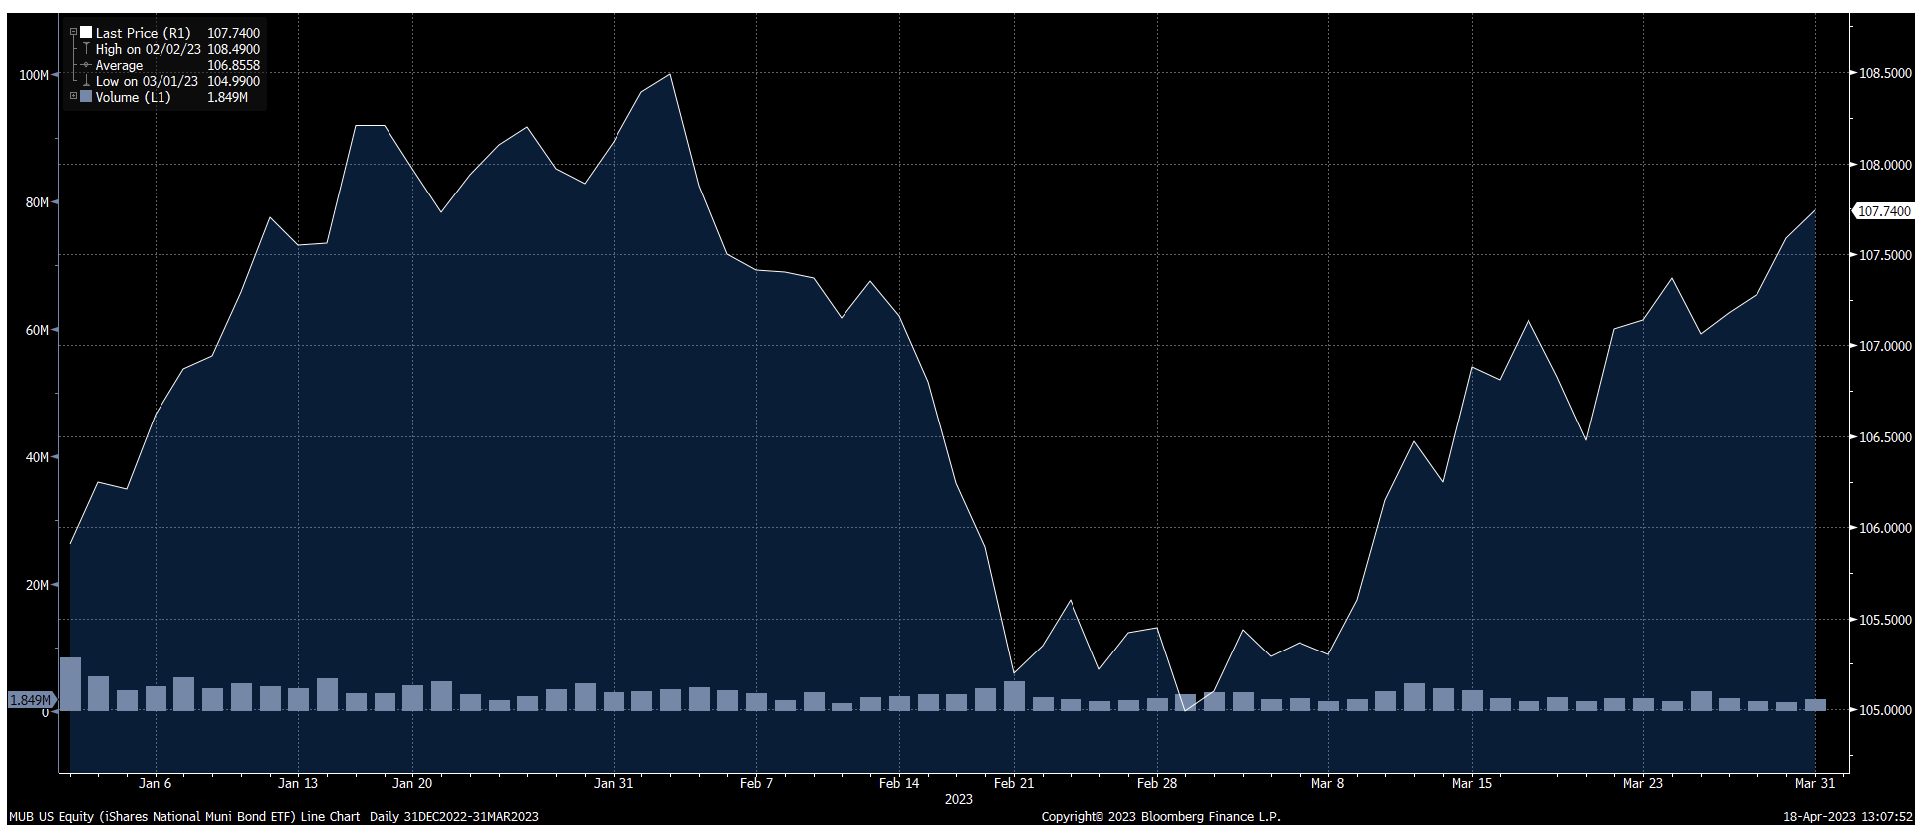
Commentary: Municipal bonds looked very similar to taxable bonds for the 1st Quarter. This Quarter, our fixed income exposure added performance to the overall portfolio.
Factors in Portfolio or of Interest
iShares MSCI USA Momentum Factor ETF (Momentum) – MTUM

Commentary: Momentum had a negative first quarter. The MTUM ETF is in our Strategic portfolio and is complemented by DGRO, the ETF explained next. We also look for momentum in Syntal Global Equity Momentum. The Momentum Index is a “risk on” type of index, so when there are concerns in the market, this index tends to underperform. The difference between the index and our Global Equity Momentum portfolio is that we can adjust to shorter-term momentum and raise cash. These abilities have led to our outperformance of the Momentum ETF (MTUM) for the first Quarter.
iShares Core Dividend Growth ETF (Dividend) – DGRO

Commentary: We own DGRO in our Strategic portfolio, and we also have the Syntal Dividend Growth strategy that tracks and looks to outperform the ETF. We believe that dividends will generally be something investors look to hold while there is higher volatility in the market. This index has been relatively flat for the first Quarter.
PACER Global Cash Cow Portfolio – GCOW
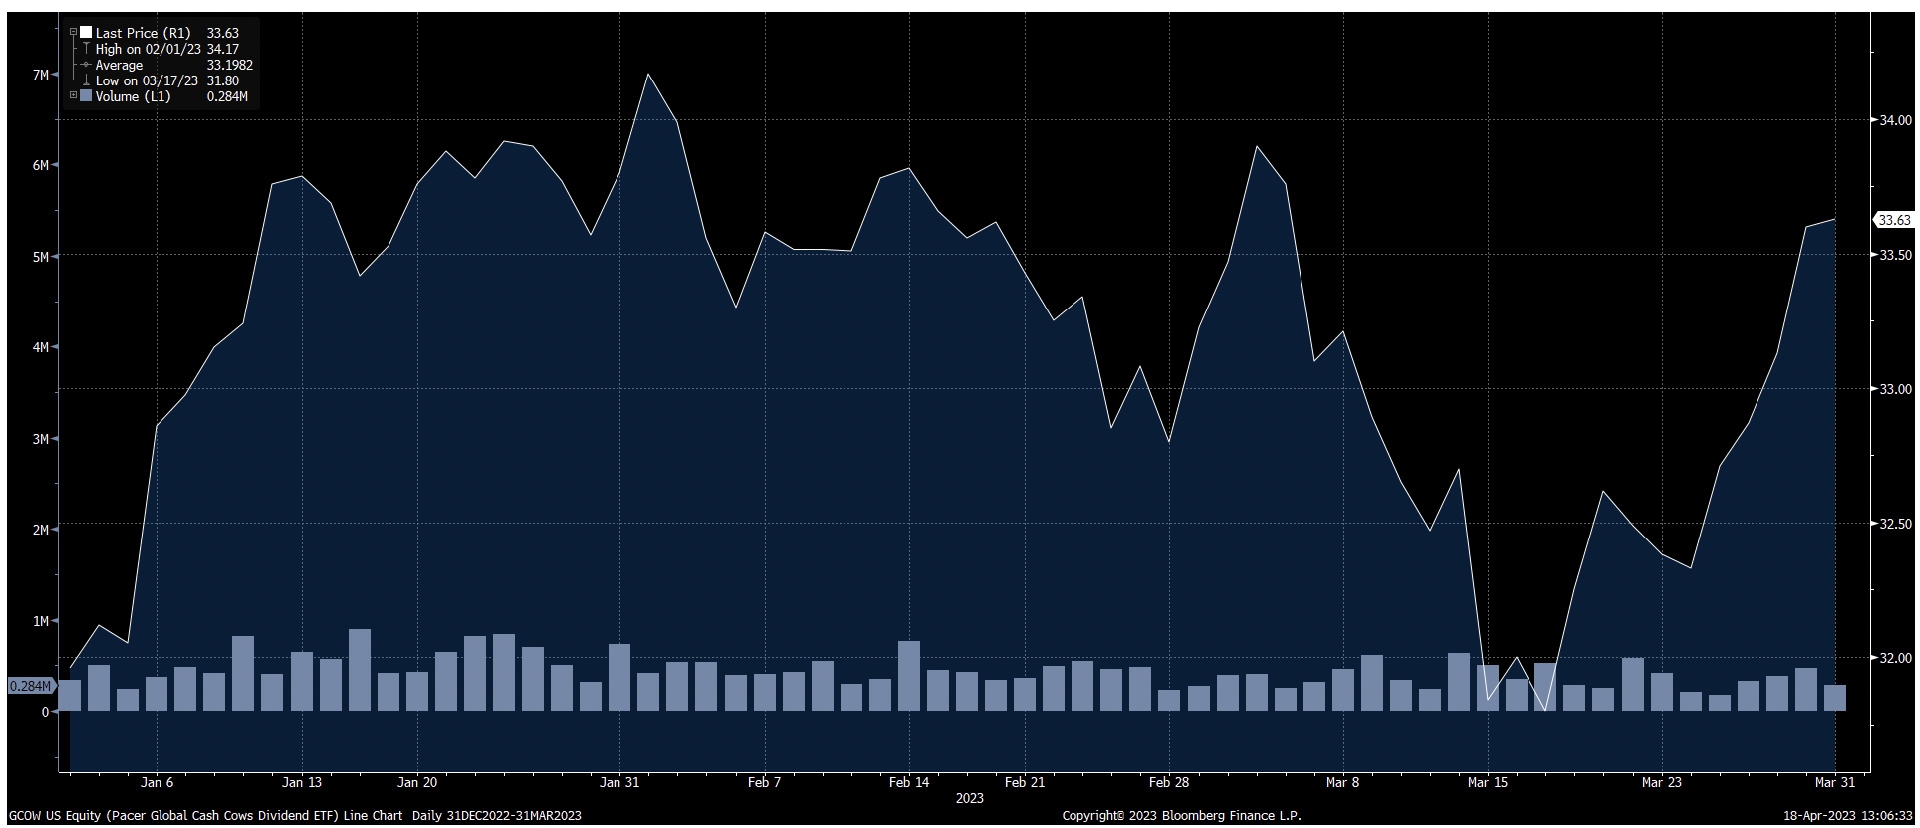
Commentary: This global dividend ETF (exchange-traded fund) aims to identify companies that can continue to pay consistent dividends through free cash flow and dividend yield screens. We continue evaluating this ETF as we seek a potential opportunity to add it to the portfolio.
Sectors in Portfolio or of Interest
SPDR Fund Energy ETF (Energy) – XLE
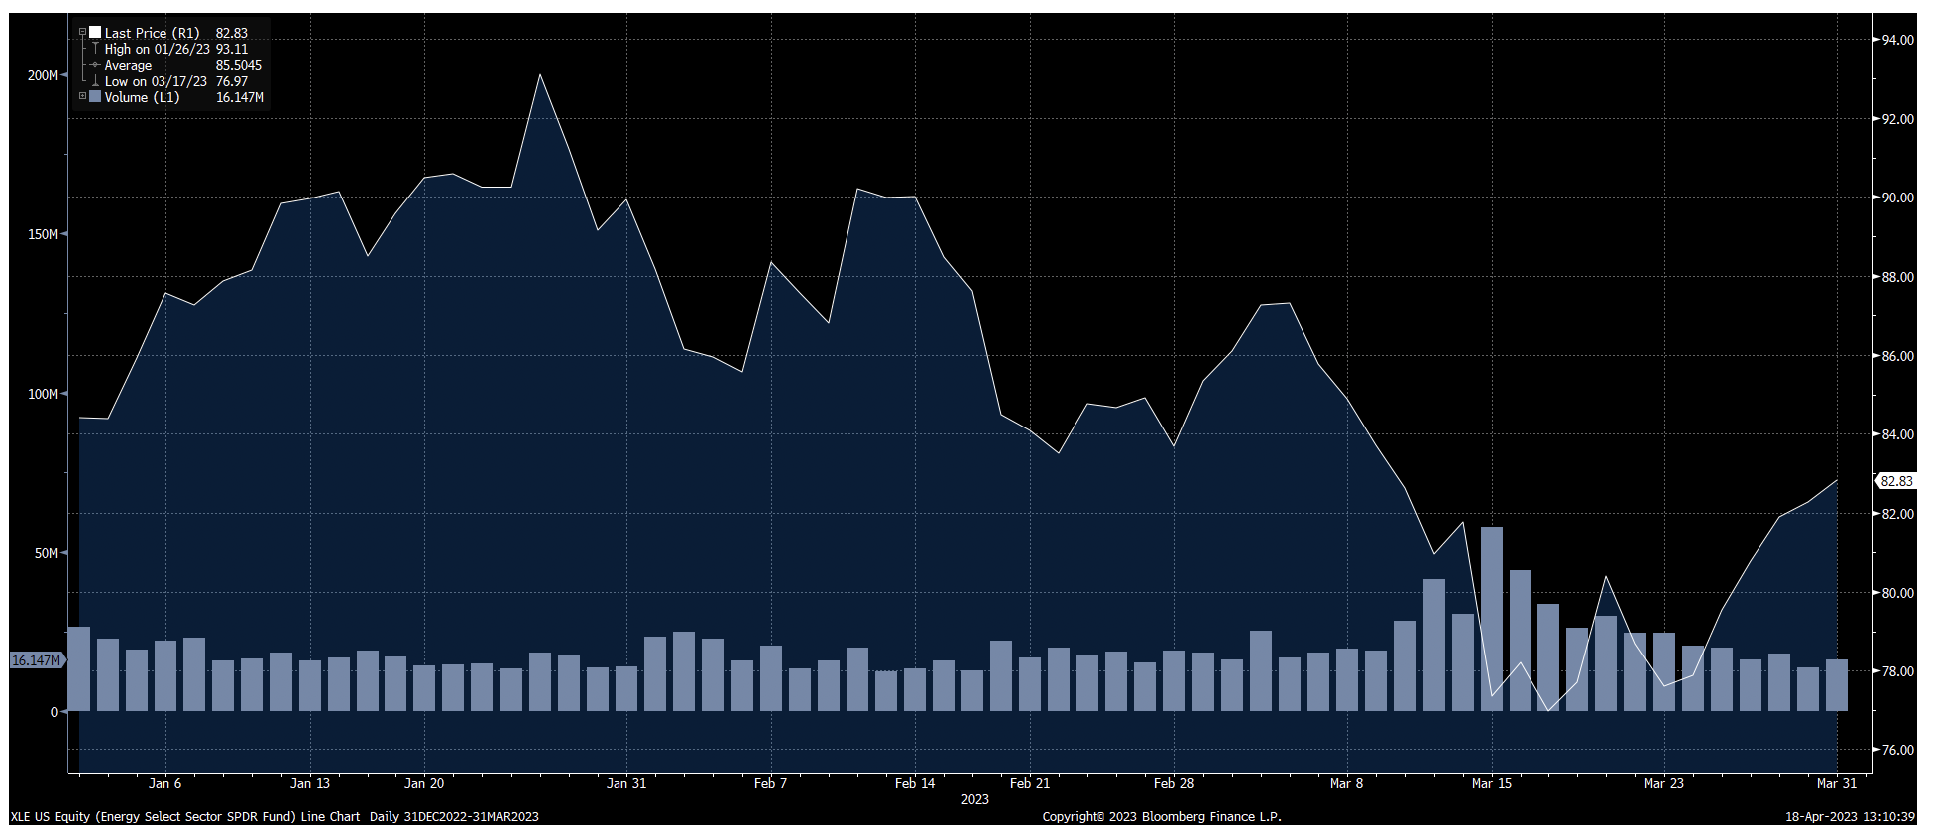
Commentary: Energy was the best-performing sector for 2022. After the outstanding performance on an absolute and a relative basis, it has experienced significantly increased volatility this Quarter. We continue looking for opportunities to add positions and exposure.
Important Disclosure Information:
Please remember that past performance may not be indicative of future results. Different types of investments involve varying degrees of risk, and there can be no assurance that the future performance of any specific investment, investment strategy, or product (including the investments and/or investment strategies recommended or undertaken by Syntal Capital Partners, LLC [“Syntal]), or any non-investment related content, made reference to directly or indirectly in this commentary will be profitable, equal any corresponding indicated historical performance level(s), be suitable for your portfolio or individual situation, or prove successful. Due to various factors, including changing market conditions and/or applicable laws, the content may no longer be reflective of current opinions or positions. Moreover, you should not assume that any discussion or information contained in this commentary serves as the receipt of, or as a substitute for, personalized investment advice from Syntal. Please remember to contact Syntal, in writing, if there are any changes in your personal/financial situation or investment objectives for the purpose of reviewing/evaluating/revising our previous recommendations and/or services, or if you would like to impose, add, or to modify any reasonable restrictions to our investment advisory services. Unless, and until, you notify us, in writing, to the contrary, we shall continue to provide services as we do currently. Syntal is neither a law firm, nor a certified public accounting firm, and no portion of the commentary content should be construed as legal or accounting advice. A copy of the Syntal’s current written disclosure Brochure discussing our advisory services and fees continues to remain available upon request or at www.syntal.com. Please Note: IF you are a Syntal client, Please advise us if you have not been receiving account statements (at least quarterly) from the account custodian. Historical performance results for investment indices, benchmarks, and/or categories have been provided for general informational/comparison purposes only, and generally do not reflect the deduction of transaction and/or custodial charges, the deduction of an investment management fee, nor the impact of taxes, the incurrence of which would have the effect of decreasing historical performance results. It should not be assumed that your Syntal account holdings correspond directly to any comparative indices or categories. Please Also Note: (1) performance results do not reflect the impact of taxes; (2) comparative benchmarks/indices may be more or less volatile than your Syntal accounts; and, (3) a description of each comparative benchmark/index is available upon request.