Summary
Our perspective has not changed much from the mid-year market commentary earlier this year. Since the 2nd Quarter commentary was published, the markets have corrected even further, and energy has still been the one shining star. The most significant difference during the 3rd quarter and now has been our position in bonds. When we went into the mid-year, we were extremely short duration in our fixed income portfolio. However, late in the 3rd quarter, we started extending duration, anticipating that we may be close to a peak in yields.
The major equity markets (S&P 500, EFA, EEM) are all still down year to date. The U.S. market is the leader, albeit still down over 20%. The market volatility is higher than we have seen in a while, reflected in the spikes in VIX (the CBOE Market Volatility Index). We have owned the leading sector, energy, in our Dividend portfolio, Global Equity Momentum portfolio, and Tactical portfolio throughout the year, dating back to the 4th quarter of 2021.
A significant differentiator this year has been that bonds have not been able to escape the madness either. The only way to reduce your risk in bonds thus far has been to have a short-duration portfolio. The longer-term Treasury ETF (TLT) is down over 30%. The fixed-income segment of portfolios is often built to help reduce risk in a volatile market. This year, however, bonds have not helped the overall portfolio’s drawdown reduction. They have added to the risk and volatility as rates have increased, worsening the situation for even your “conservatively” invested portfolios. The good news is that we anticipated this could happen and reduced our maturities early in the year, drastically improving our bond portfolio returns and reducing volatility. We have since extended the duration as we have seen the ten-year yield increase to 4%. We anticipate that longer-term bond yields could be approaching their peak, and with a potential recession looming, we could see lower rates moving forward.
In 2022, the sector that has shined above all others is energy. This sector is positive in a year where all other sectors are flat to negative. The other two sectors that have done better this year are Staples (XLP) and Utilities (XLU). Last year in the 4th quarter, we made this statement: “Moving into 2022, we anticipate continued volatility and potential for further downside while remaining bullish on Energy with an expectation of continued leadership.” This statement has proven to be true this year and, with our accompanying shifts, greatly added to the portfolio’s downside reduction.
As we have stated over the past several years, we have been and continue to watch three main things: Fiscal policy, Monetary policy, and interest rates. Our views have been that low rates coupled with easing Monetary and Fiscal policy would likely result in continued higher prices. That environment, however, shifted early this year. We now have tightening Monetary policy, nonexistent Fiscal policy, and rising rates. These fundamental shifts considered, we believe this correction we are in could last longer than expected.
Monetary policy, Fiscal policy, and rates continue to be vital drivers and catalysts as we look to anticipate the shifting of environments and cycles. It is, however, harder to identify signals for when markets could begin to rebound from a downtrend. This is why we also look at statistics to give us the potential for better risk-reward entries. Several signals and statistics help identify these entry points, such as price momentum, sentiment, inflation, and economic growth. Still, the market can and usually does turn around before most economic and fundamental signals turn themselves.
Therefore, we will use these signals as confirmation alongside the statistics to determine multiple entry points as we move forward and look for opportunities.
Please see below for further detailed analysis and chart references. If you have any questions or want to discuss anything mentioned, please do not hesitate to reach out. We appreciate each of you and your confidence in us to manage these turbulent times.
All the best,
Syntal Investment Team
Drawdown Analysis
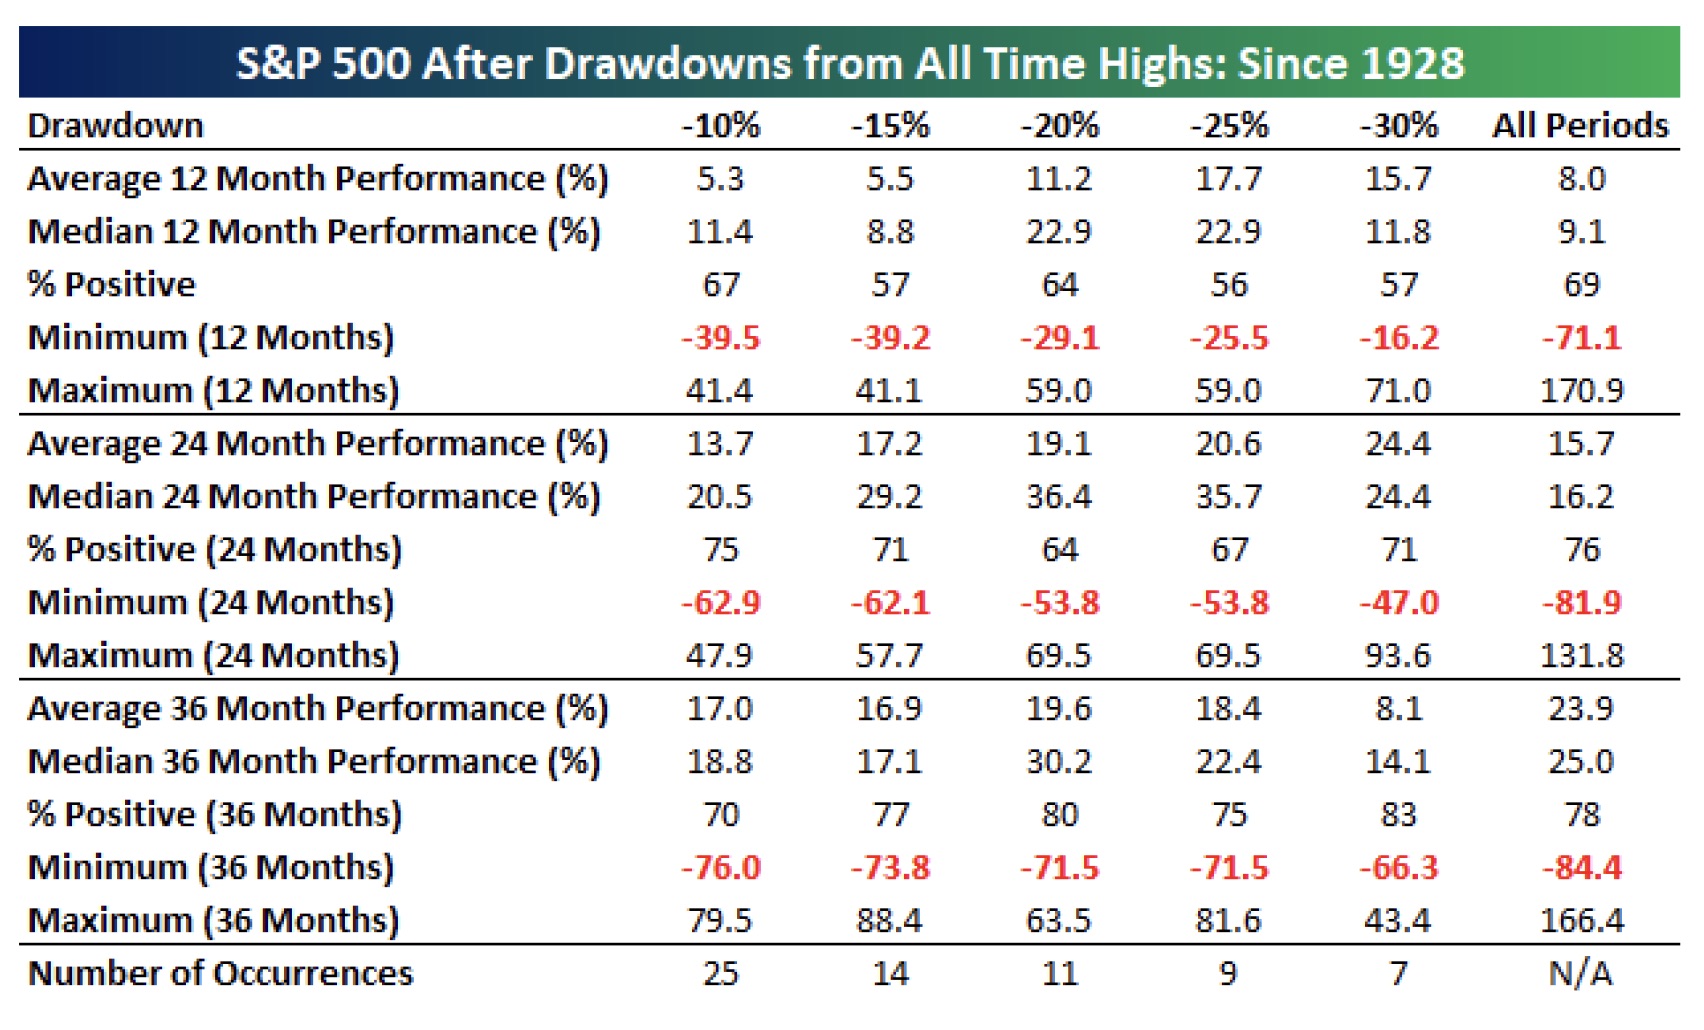
We are currently in a corrective mode in the markets. This can be concerning when you see the value of your portfolio lower on the year. The good news is we have done well in our strategies thus far, and while we don’t like to be down, we are happy with the low downside capture we have achieved this year. We have now turned our focus to the potential for tax-loss harvesting and the opportunity to add back into risk assets. The chart below will give you some market history, what types of corrections have happened, and how long it took to get back to positive returns after the correction.
We are currently between the -20% and -25% drawdown ranges. If you look at the chart, the average 12-month performance is between 11.2% and 17.7%. The average 24-month performance is between 19.1% and 20.6%. And the average 36-month performance is between 19.6% and 18.4%.
These levels are why we have started adding additional risk to our tactical portfolios. While we feel like the stats can drive decisions to add, we still are not seeing the capitulation we would like to see to get more aggressive. At this point, we are just sticking our toes in the water until we see further confirmation of an actual bottom in the market.
Major Markets
Equities
S&P 500 ETF (US Market) – SPY
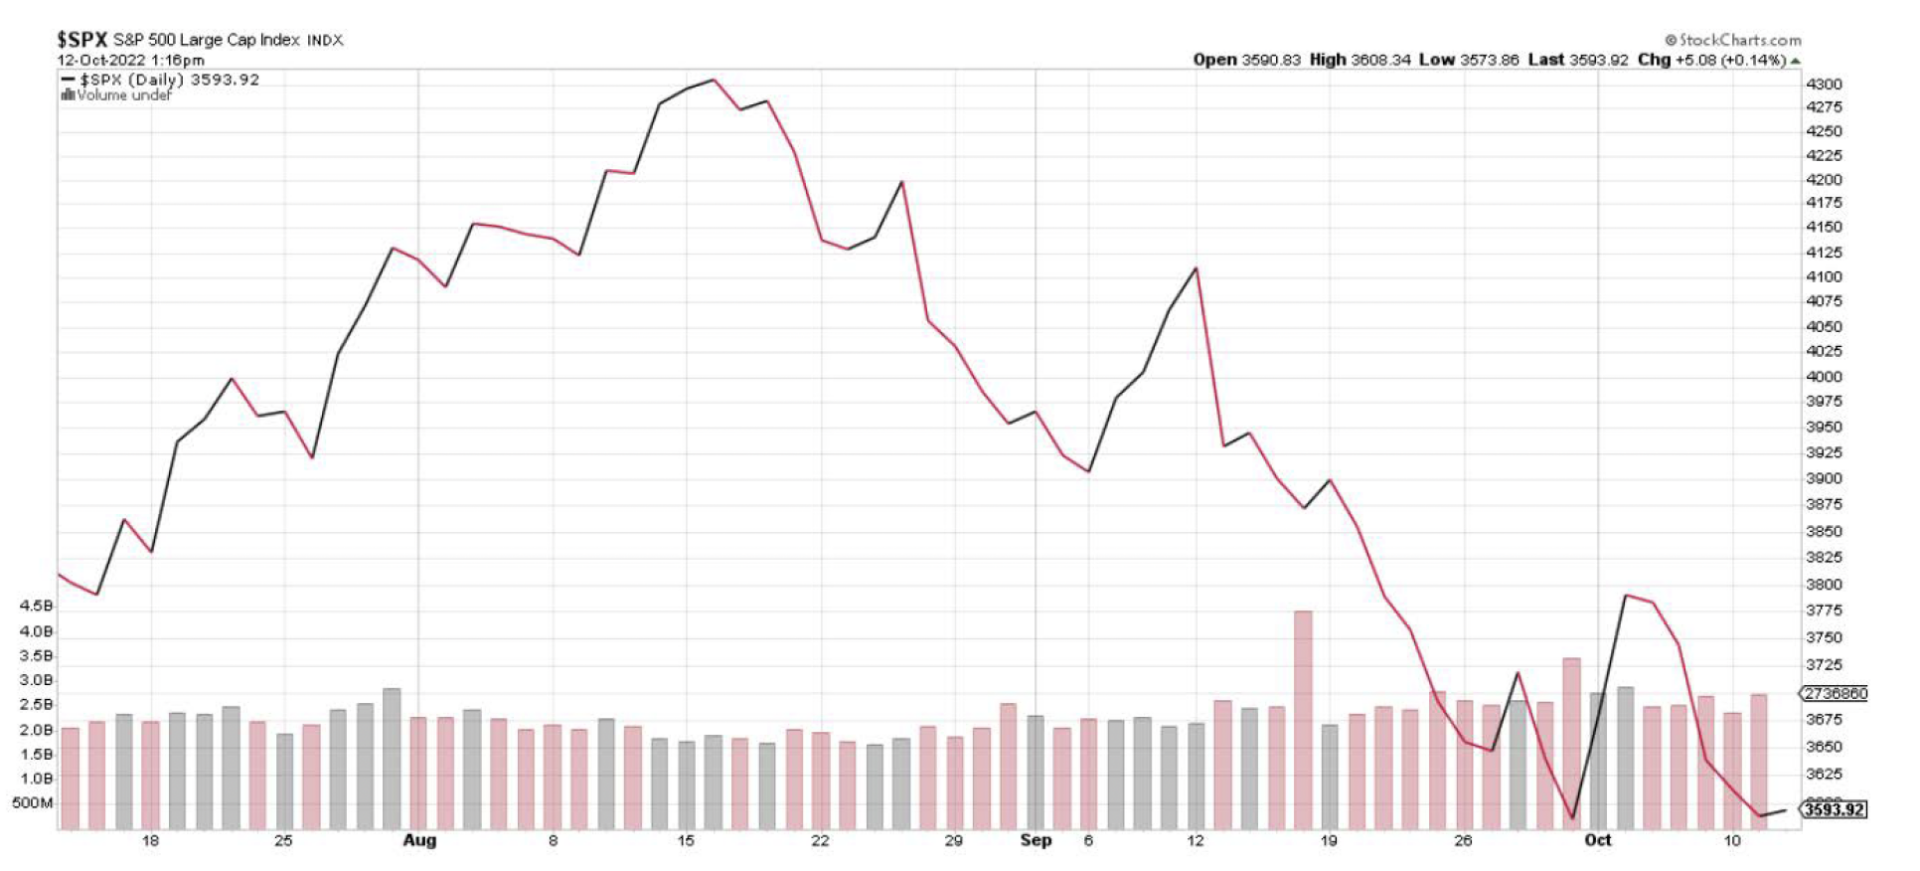
Commentary: The S&P 500 led the major markets in performance for 2021. It is down over 21% as of this writing, but that is better than all other major markets. While we do not have a crystal ball, we expect to see more volatility this year. With that in mind, we reduced our S&P 500 Index holding in our strategic portfolio to the lower end of the range early in the second quarter and have not yet changed our position.
MSCI EAFE ETF (Developed International Market) – EFA

Commentary: The EAFE Index is also down significantly this year. Continued volatility is the current outlook, and we have reduced our position in this holding to the lower end of the range.
MSCI Emerging Markets ETF (Emerging Markets) – EEM
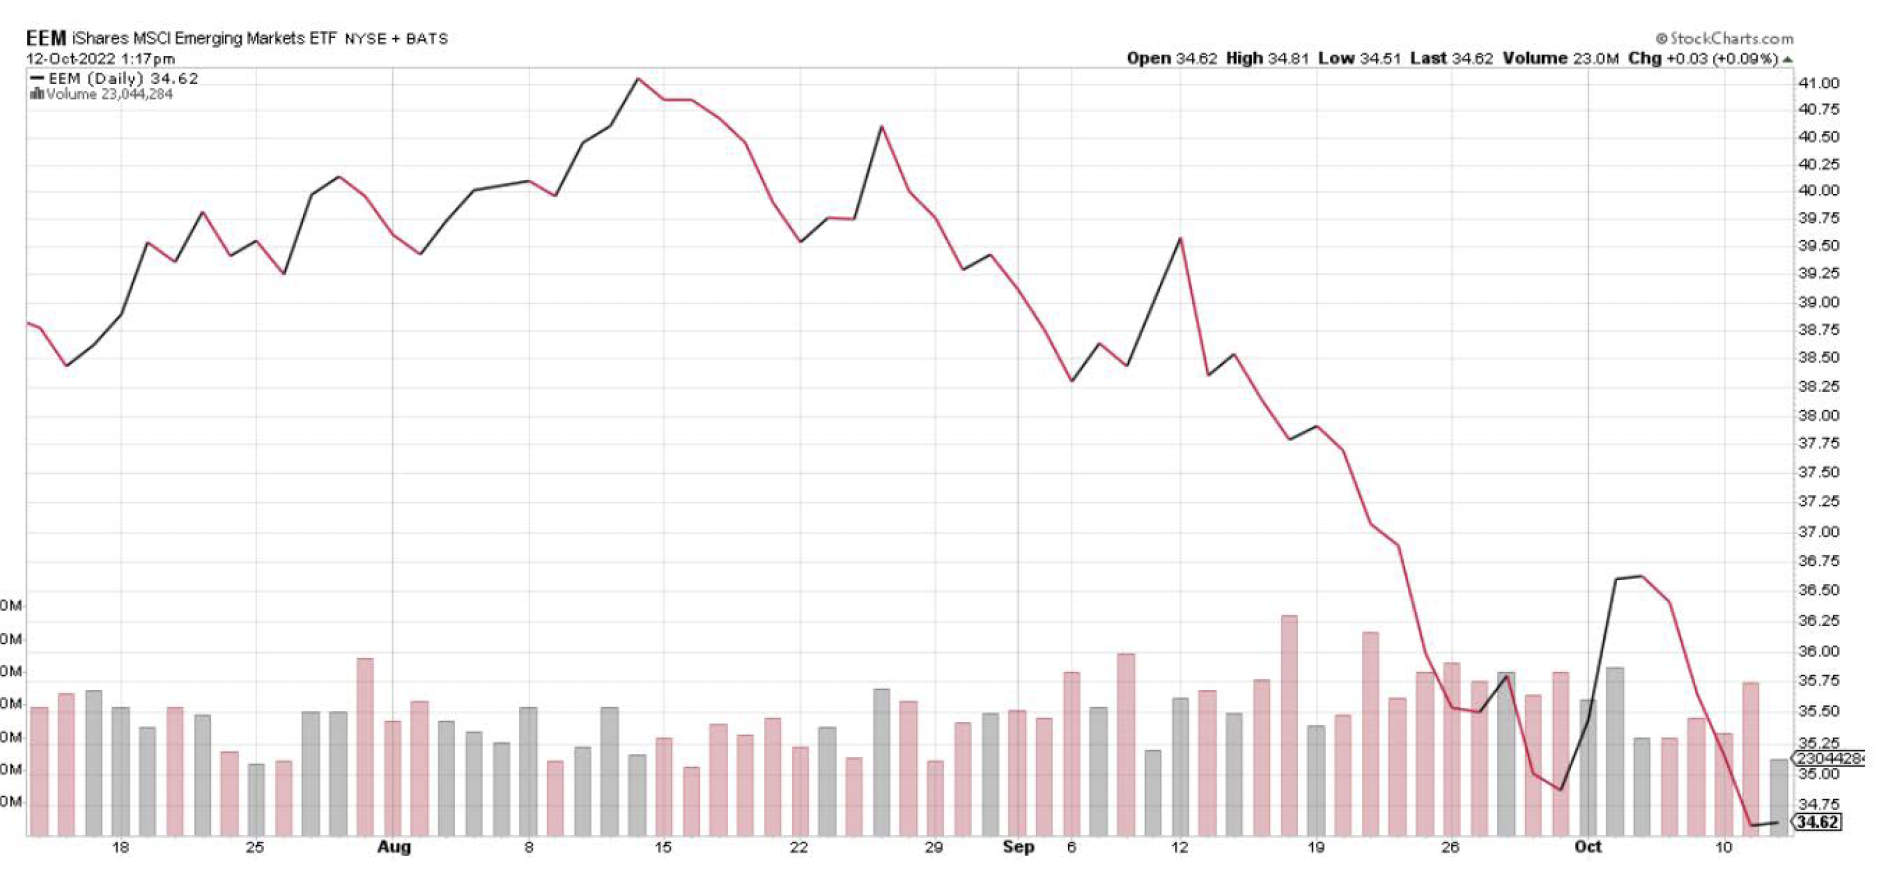
Commentary: Emerging Markets has had a few bad years as of late, and this year isn’t any different. At some point, this index will give us an opportunity, but at this time, with the “Risk Off” mentality of the market, this is not something we are looking to buy.
MSCI ACWI ETF (Global Market) – ACWI
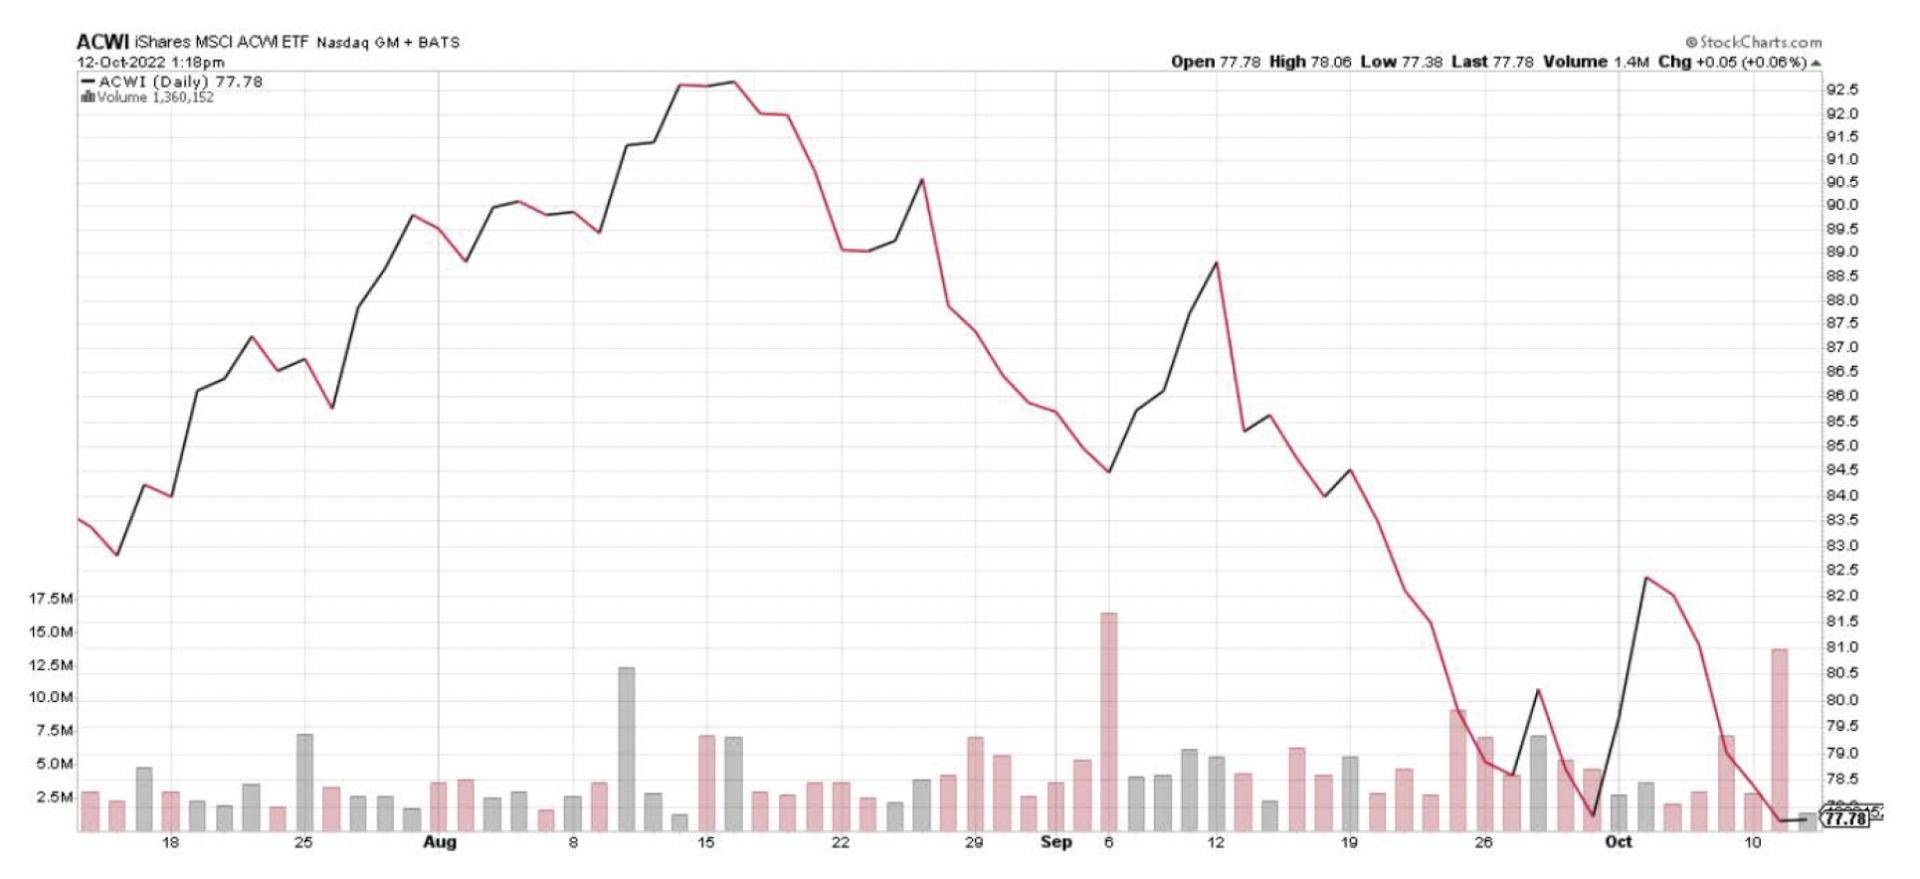
Commentary: The ACWI is a Global Market ETF that combines U.S., Developed International, and Emerging Markets. U.S. Markets are driving this combined index performance.
Broader Market Performance
As of October 11th, the best performing market YTD is the S&P 500 (-24.18%), the MSCI ACWI in second down (-26.11%), MSCI EAFE (-27.65%) in third, and MSCI Emerging Markets (-28.65%) fourth. All major indexes are down and within about 2% to 4% of each other.

US Sector Performance
The best-performing U.S. sector year-to-date was energy, with Utilities coming in second and Staples in third. Full U.S. sector performance year-to-date is below, with Discretionary and Technology being the worst two sectors.

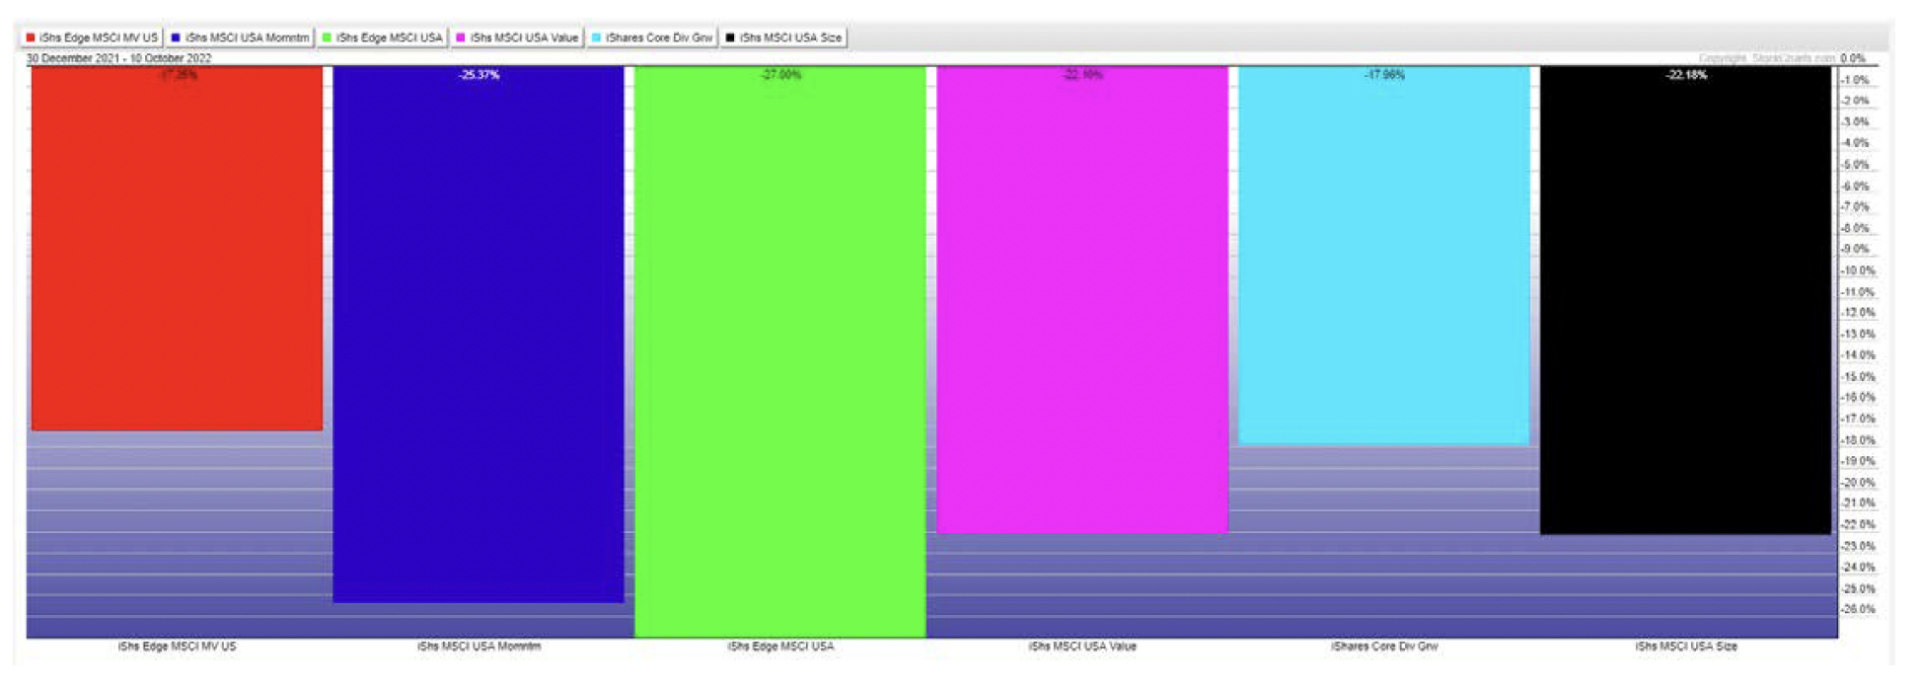
US Factor Performance
The best performing factor for year-to-date was Low Volatility (USMV), followed by Dividend Growth (DGRO).
Fixed Income
iShares 20 + Years Treasury Bond (Long Term Bonds) – TLT
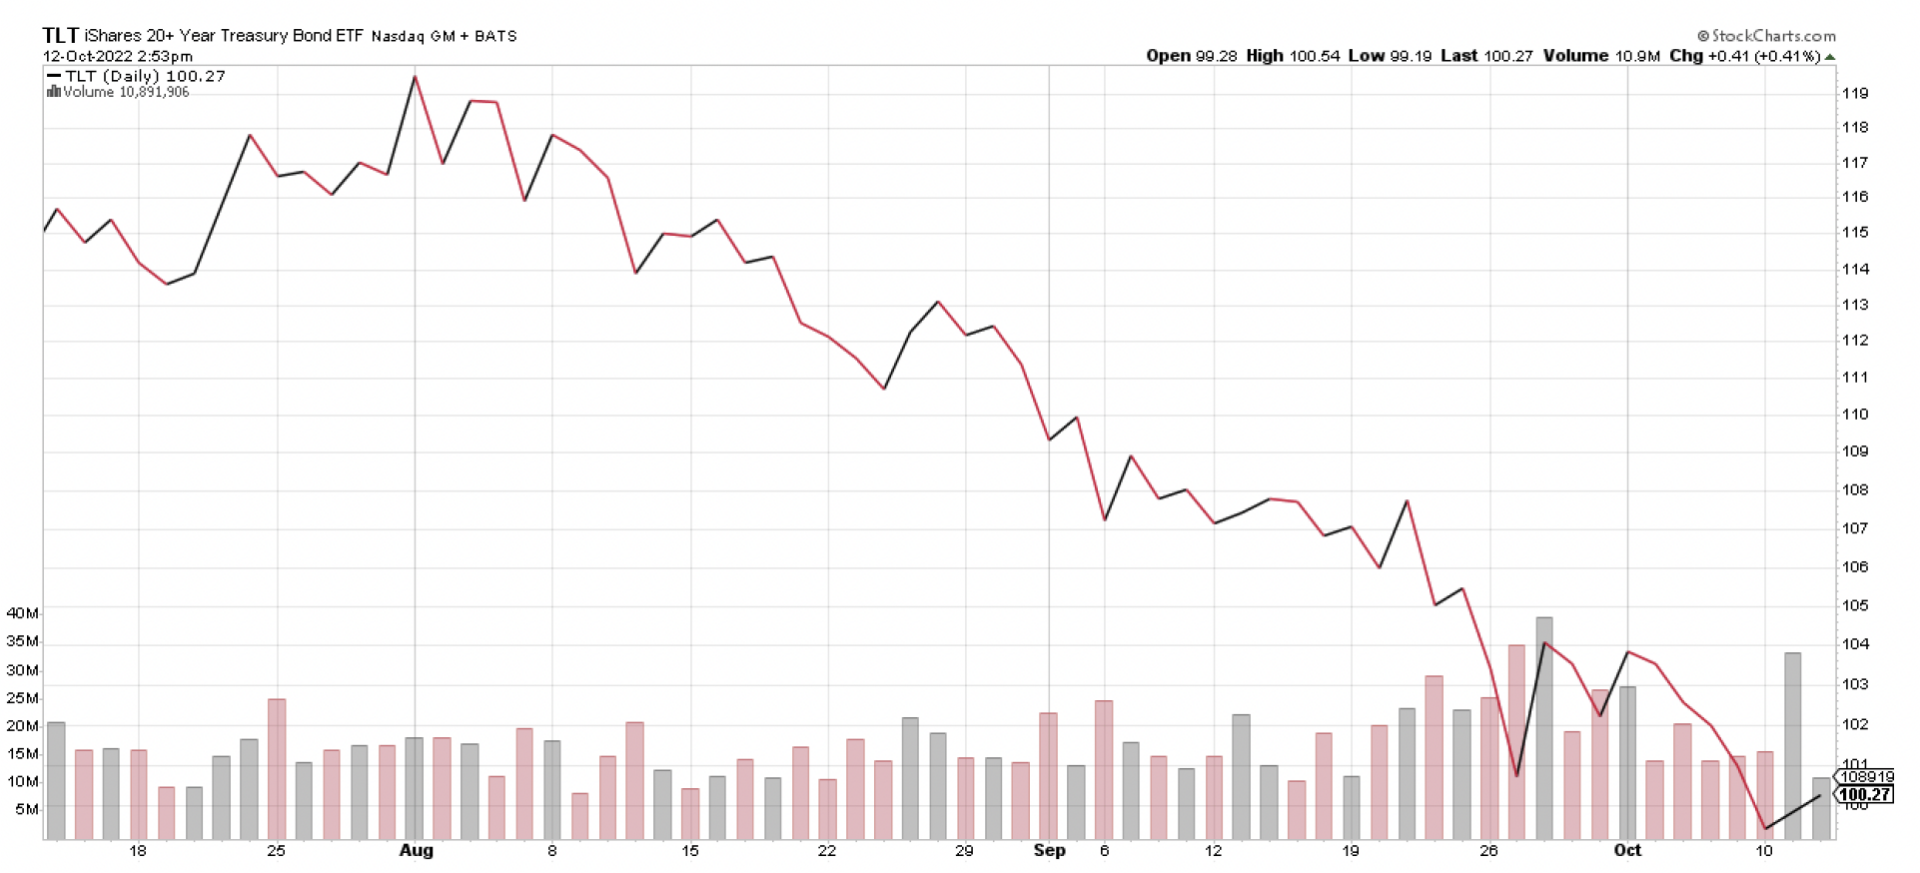
Commentary: When rates move up, the prices of bonds move down. The above chart is the longer-term treasury index, and it has moved down over 33% year-to-date as rates have gone up. In our opportunistic portfolio, we held TLT for a short time when rates went above 3.85%.
iShares Core US Aggregate Bond (Bonds) – AGG
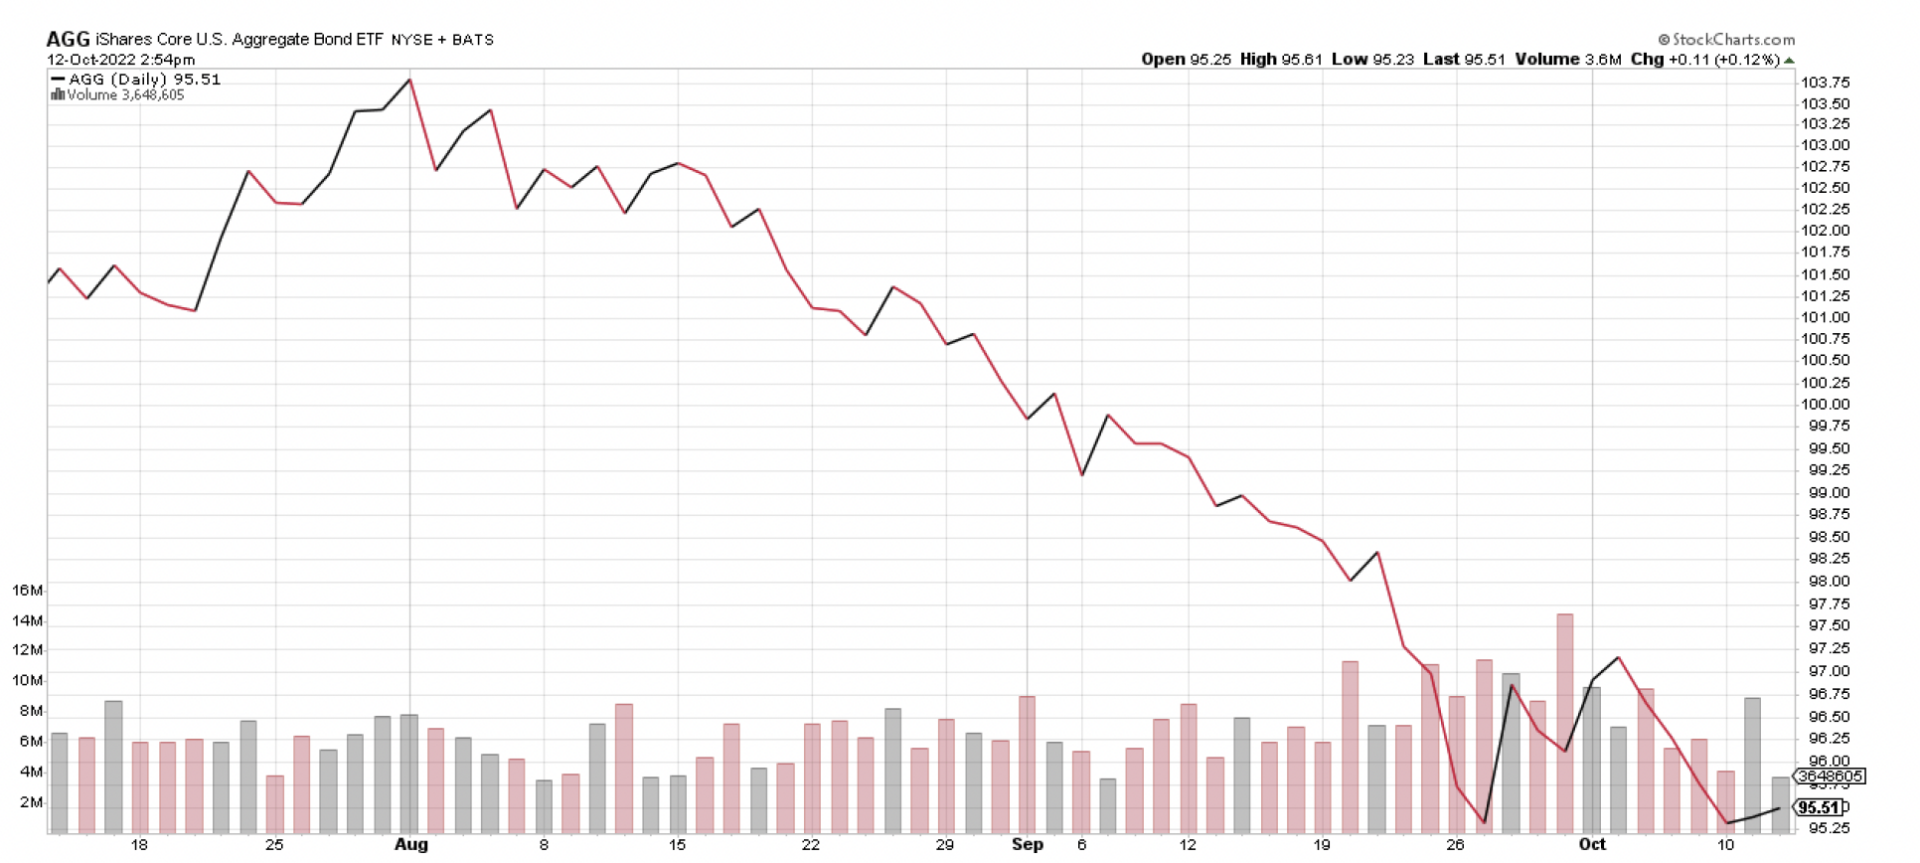
Commentary: This is the U.S. Core Aggregate Bond Index. The duration of this index is shorter than the long-term treasury index above; therefore, it is down less at just over 16% year to date. The shorter the duration, the better you have done while interest rates have increased. As we have seen interest rates move up, we have increased our duration.
iShares 1-3 Year Treasury Bond (Short Term Bonds) – SHY
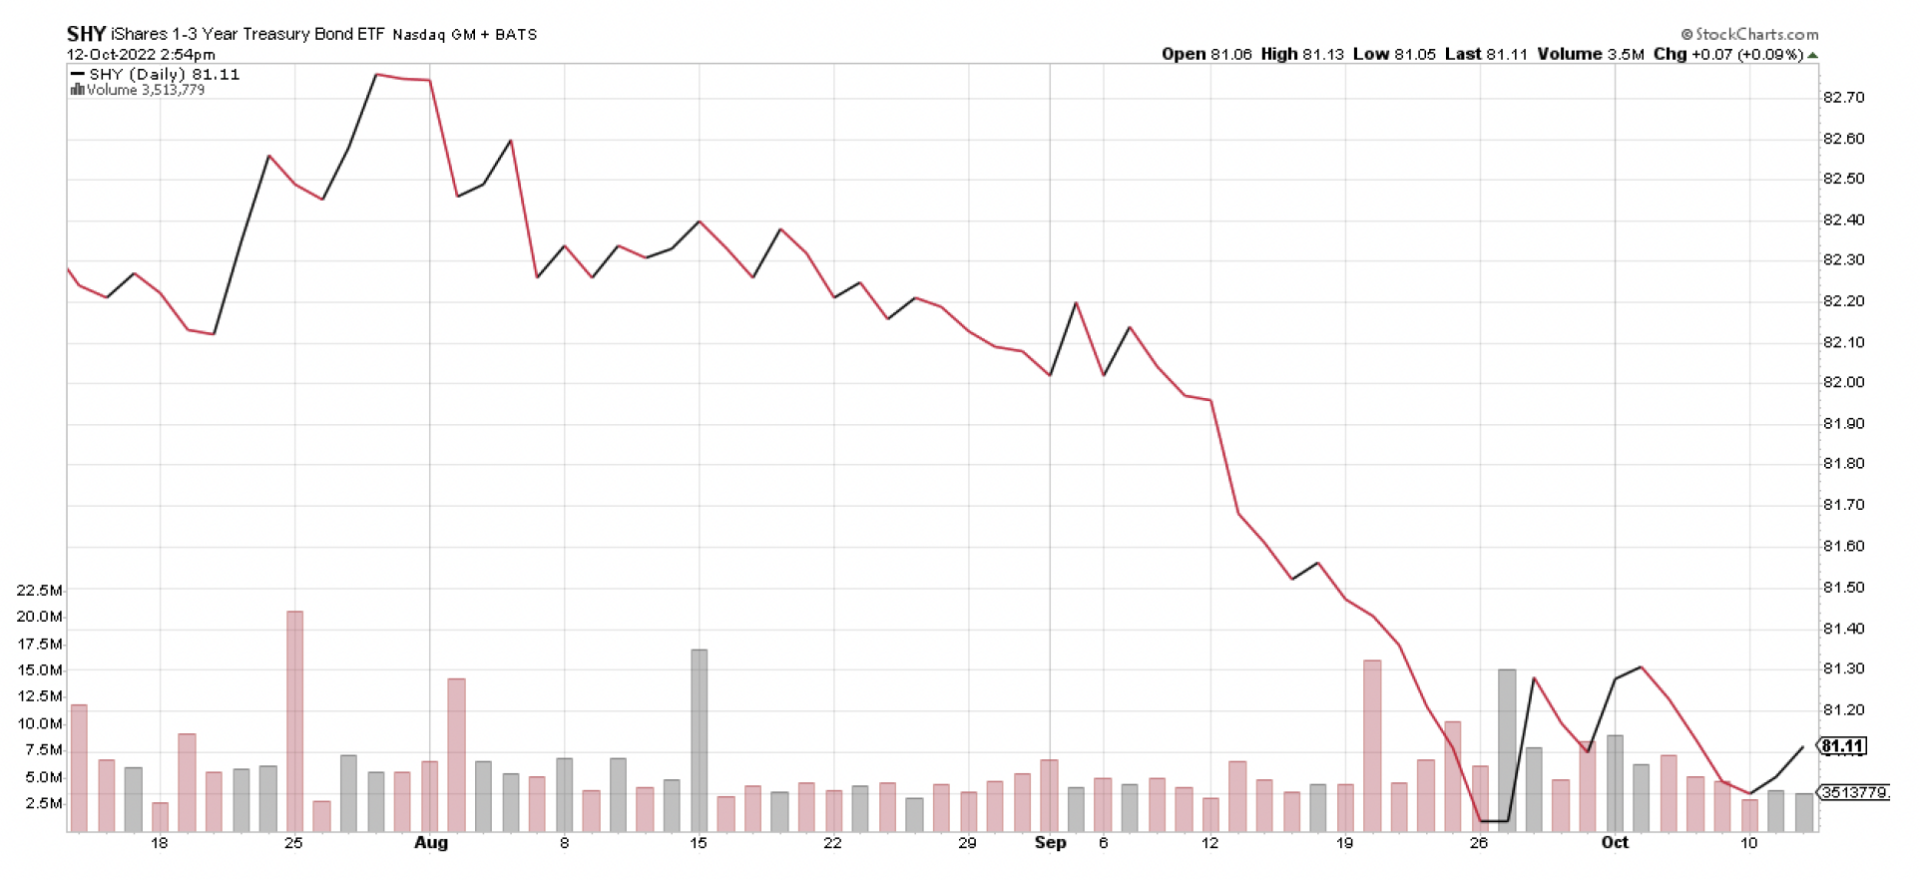
Commentary: This is the short-term Treasury bond index. It has a duration of just under two years. This index is down around 5% year to date. Again, the shorter the duration, the better you have done this year.
iShares National Muni Bond ETF (Municipal Bonds) – MUB

Commentary: Municipal bonds have not been excluded from this downturn in bonds. Year-to-date MUB (Municipal bond ETF) is down around 11%. While you can see less volatility in the municipal market, the rule still holds true when rates move up, bond prices move down.
Factors in Portfolio or of Interest
PACER Global Cash Cow Portfolio – GCOW
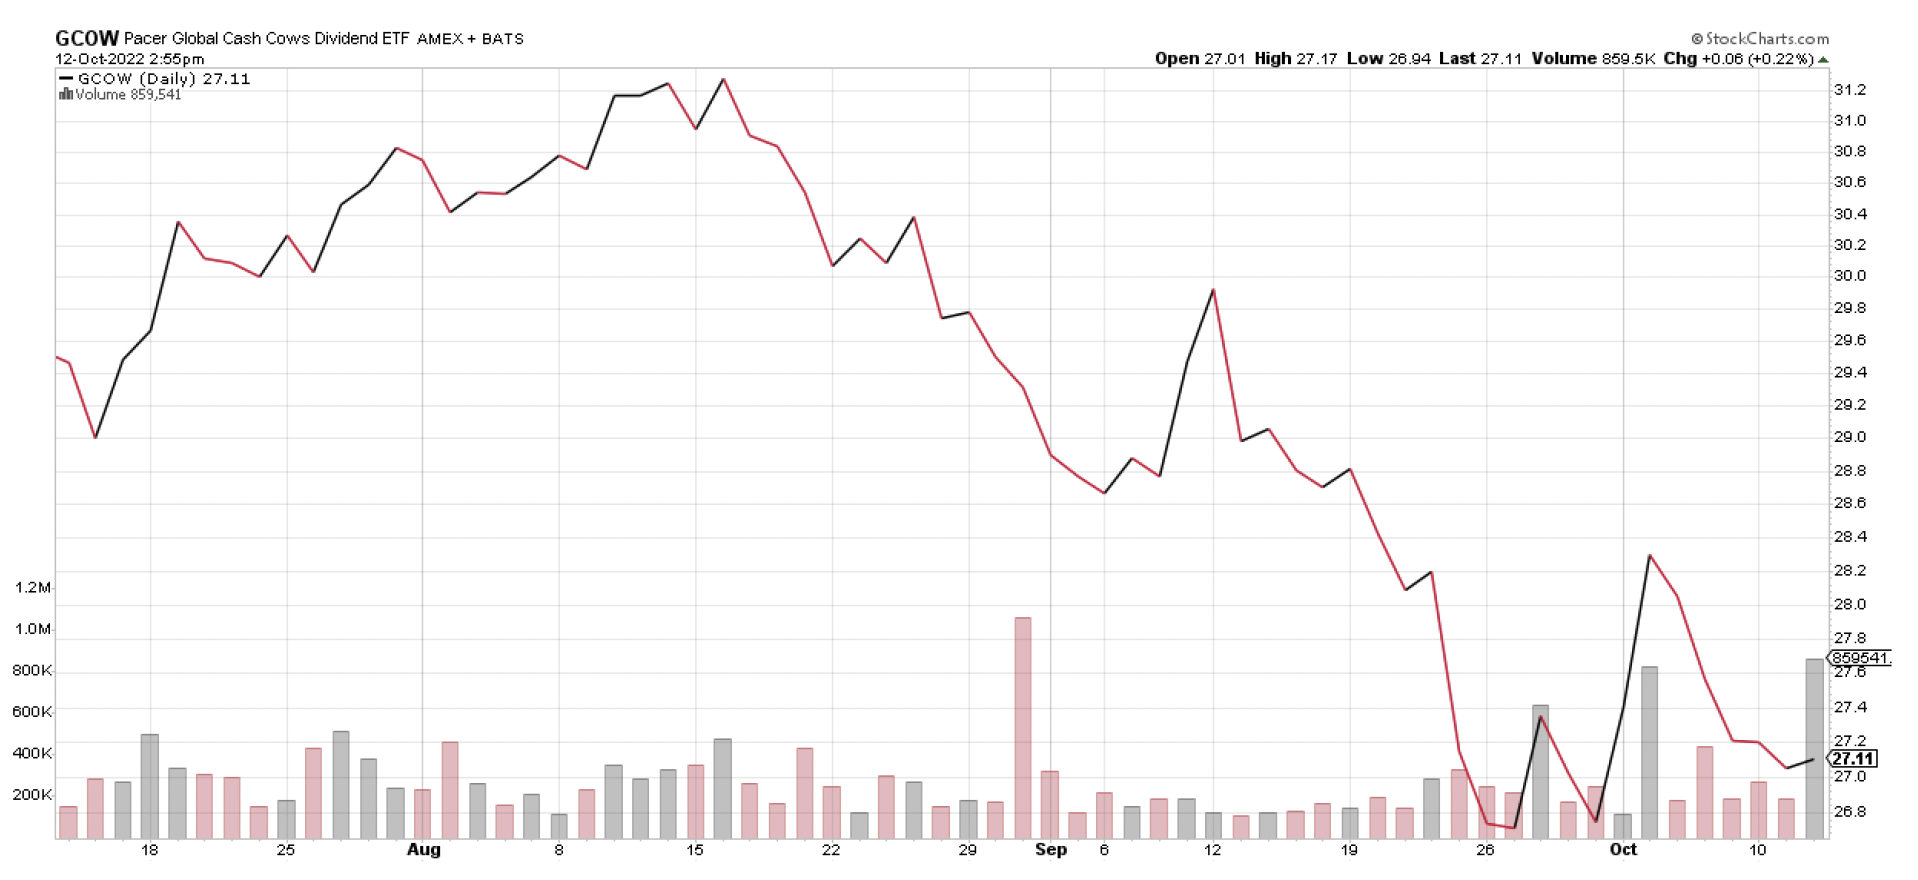
Commentary: We added GCOW to the portfolio in the second quarter of this year. This global dividend ETF (exchange-traded fund) aims to identify companies that can continue to pay consistent dividends through a free cash flow yield screen and dividend yield screen. With the market continuing to correct and the rallies generally favoring the lower-quality stocks, we exited this position in the third quarter.
iShares MSCI USA Momentum Factor ETF (Momentum) – MTUM
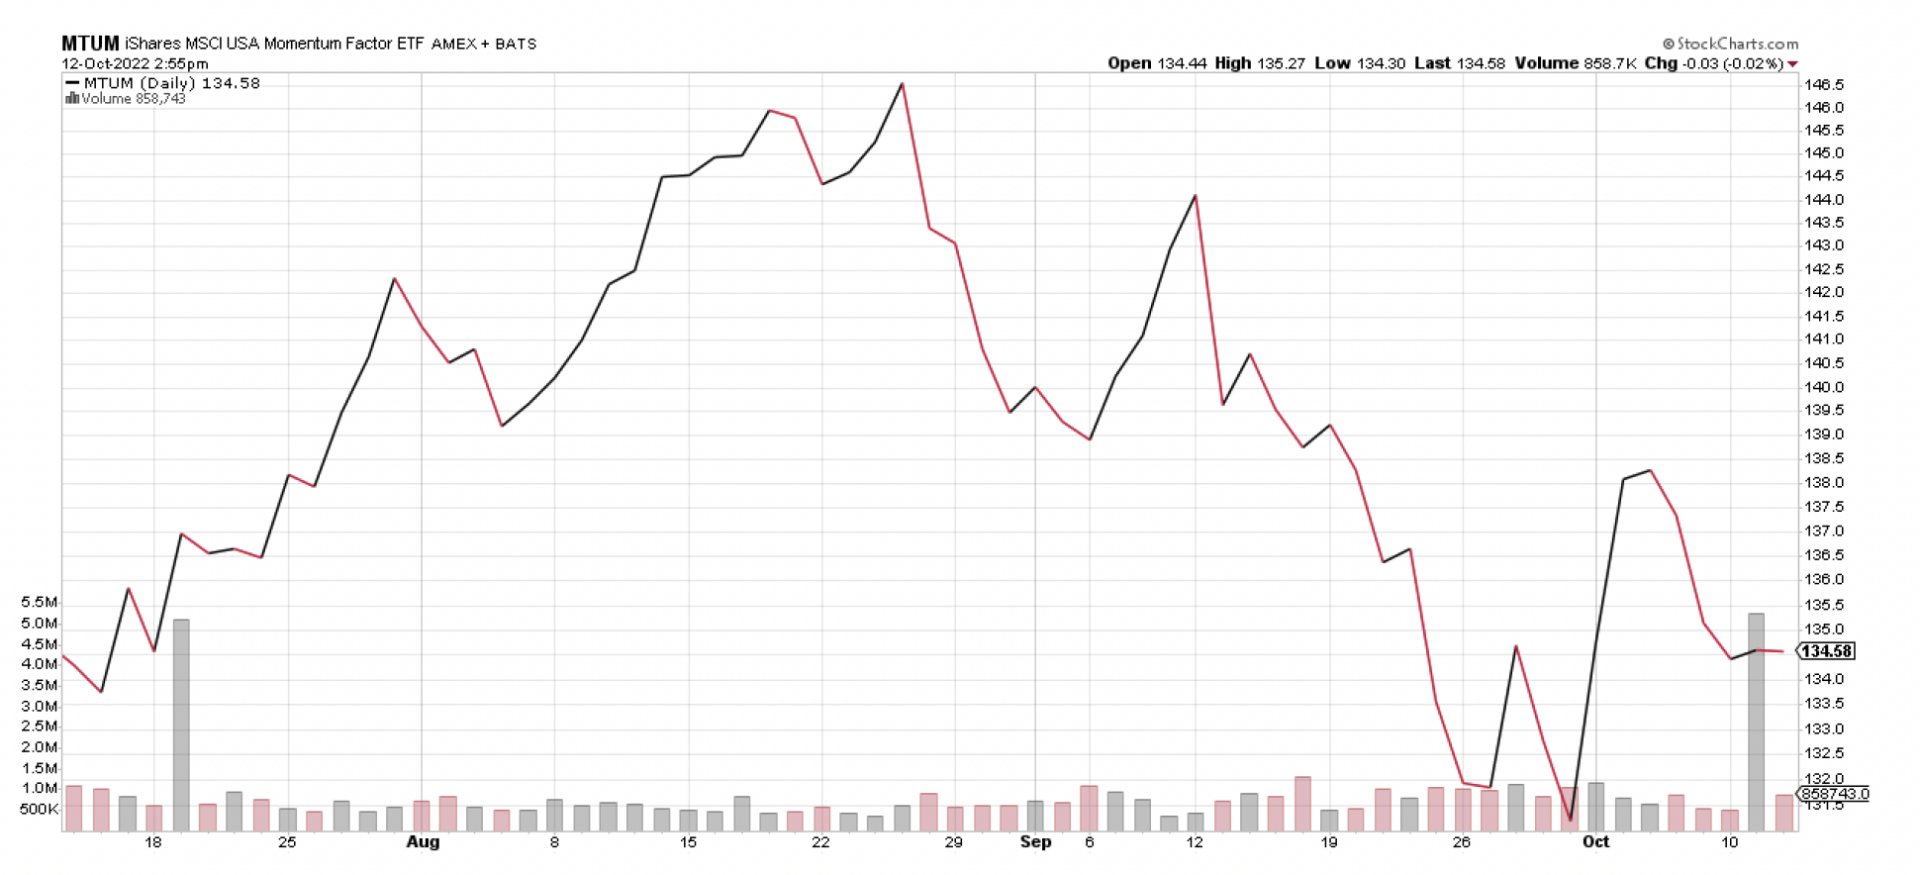
Commentary: Momentum had a positive first quarter but was the lowest-performing factor year-to-date. The MTUM ETF is in our Strategic portfolio and is complemented by DGRO, the ETF explained below. We also look for momentum in Syntal Global Equity Momentum as well. While the Momentum Index has done terribly this year, we have been able to outperform in our Syntal Global Equity Momentum strategy. This factor does however tend to influence our performance in the overall portfolio.
iShares Core Dividend Growth ETF (Dividend) – DGRO
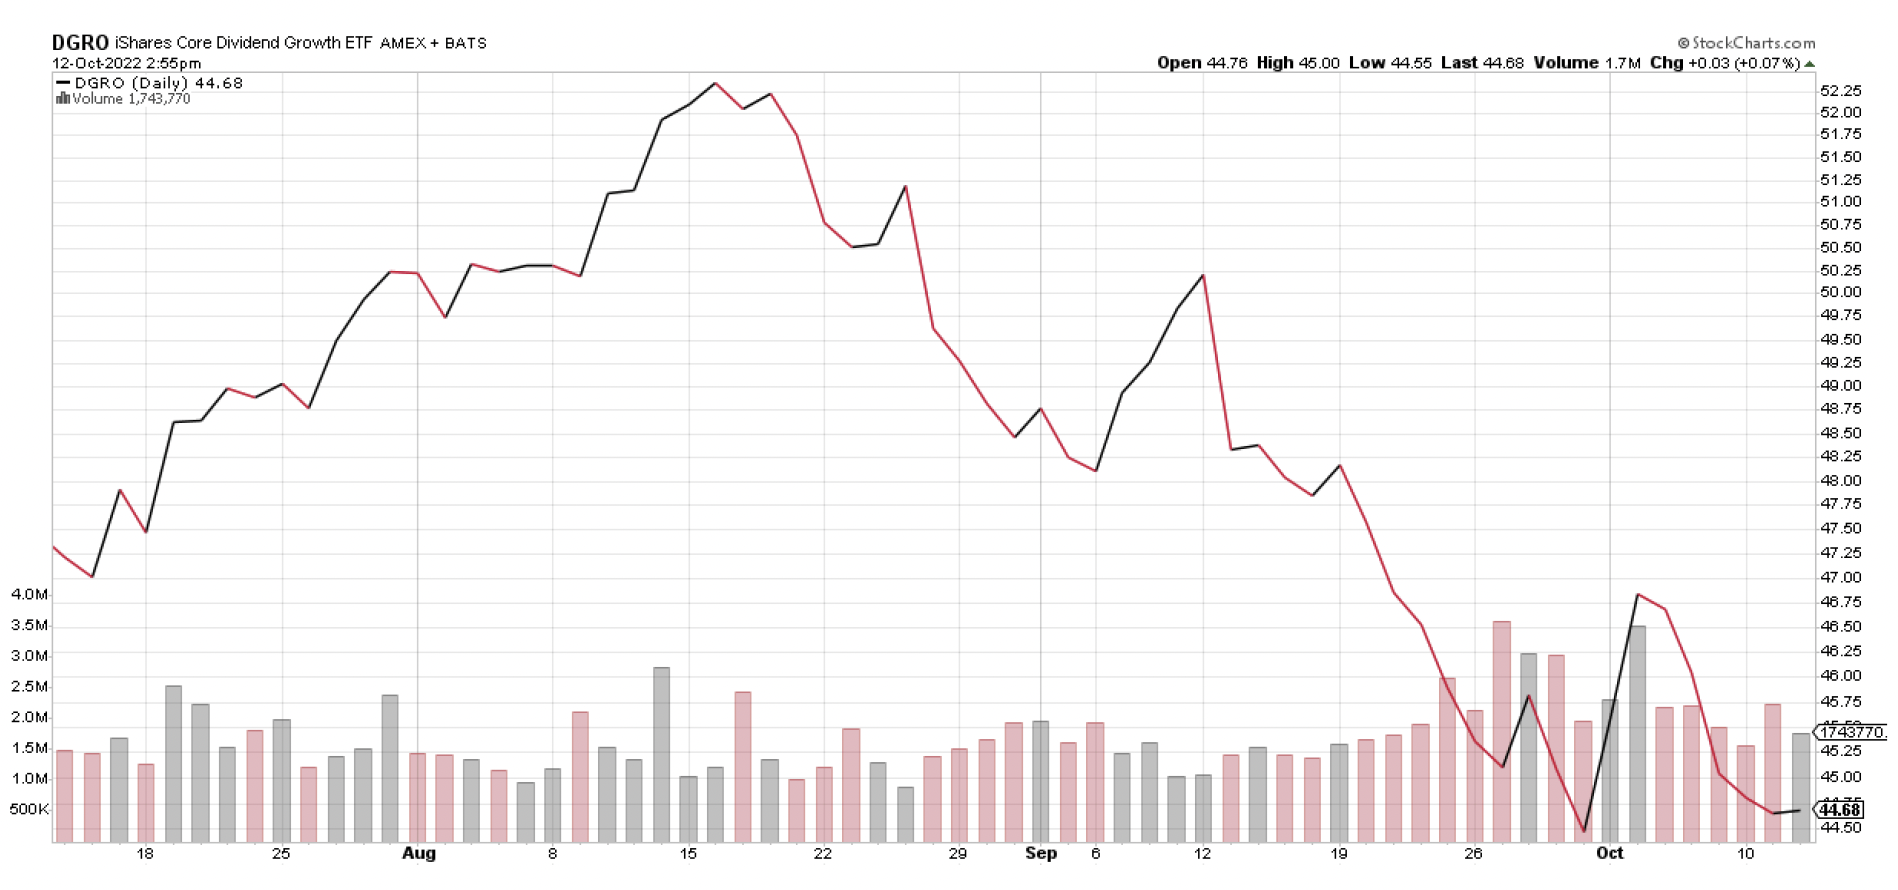
Commentary: We own DGRO in our Strategic portfolio, and we also have the Syntal Dividend Growth strategy that tracks and looks to outperform the ETF. We believe fixed-income yields will continue to be low, so we have added Dividend factor exposure to increase portfolio cash flow while participating in the equity market. We also believe that dividends will generally be something that investors look to hold while there is higher volatility in the market.
Sectors in Portfolio or of Interest
Spider Fund Energy ETF (Energy) – XLE
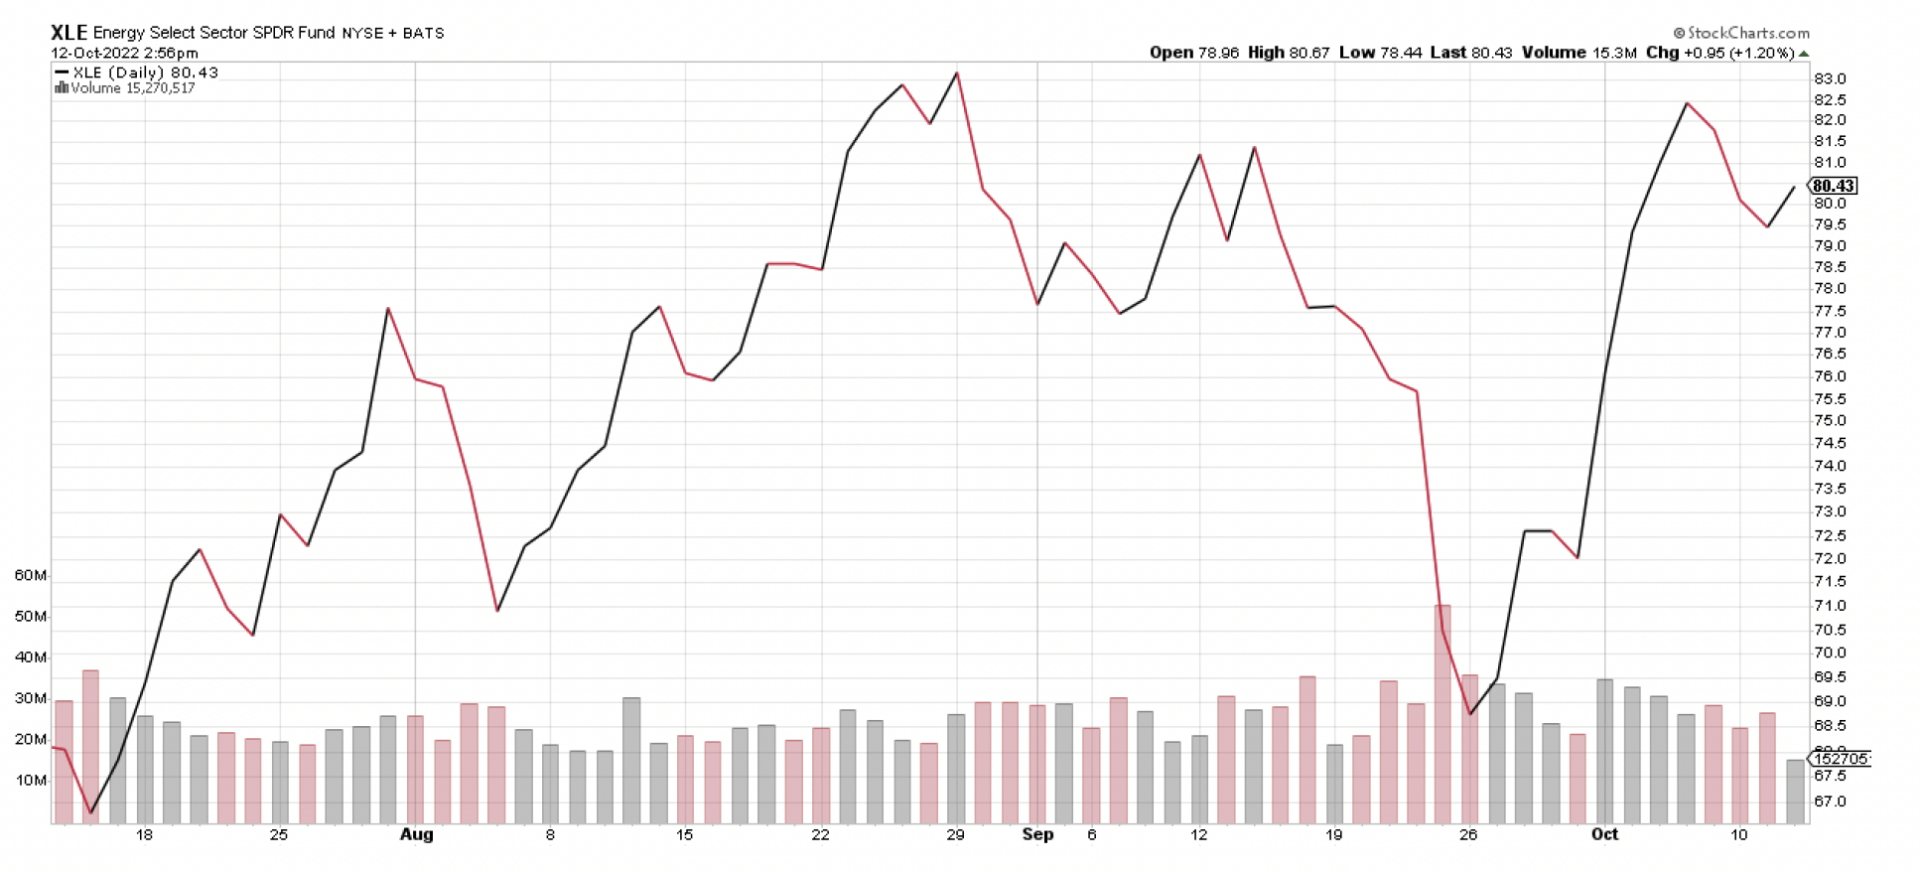
Commentary: Energy was the best-performing sector for 2021, and it looks like it could continue that move in 2022. We continue to look for opportunities to add positions in this sector. We believe that energy remains the place to hide and will re-evaluate our thoughts as we move forward.
Important Disclosure Information:
Please remember that past performance may not be indicative of future results. Different types of investments involve varying degrees of risk, and there can be no assurance that the future performance of any specific investment, investment strategy, or product (including the investments and/or investment strategies recommended or undertaken by Syntal Capital Partners, LLC [“Syntal]), or any non-investment related content, made reference to directly or indirectly in this commentary will be profitable, equal any corresponding indicated historical performance level(s), be suitable for your portfolio or individual situation, or prove successful. Due to various factors, including changing market conditions and/or applicable laws, the content may no longer be reflective of current opinions or positions. Moreover, you should not assume that any discussion or information contained in this commentary serves as the receipt of, or as a substitute for, personalized investment advice from Syntal. Please remember to contact Syntal, in writing, if there are any changes in your personal/financial situation or investment objectives for the purpose of reviewing/evaluating/revising our previous recommendations and/or services, or if you would like to impose, add, or to modify any reasonable restrictions to our investment advisory services. Unless, and until, you notify us, in writing, to the contrary, we shall continue to provide services as we do currently. Syntal is neither a law firm, nor a certified public accounting firm, and no portion of the commentary content should be construed as legal or accounting advice. A copy of the Syntal’s current written disclosure Brochure discussing our advisory services and fees continues to remain available upon request or at www.syntal.com. Please Note: IF you are a Syntal client, Please advise us if you have not been receiving account statements (at least quarterly) from the account custodian. Historical performance results for investment indices, benchmarks, and/or categories have been provided for general informational/comparison purposes only, and generally do not reflect the deduction of transaction and/or custodial charges, the deduction of an investment management fee, nor the impact of taxes, the incurrence of which would have the effect of decreasing historical performance results. It should not be assumed that your Syntal account holdings correspond directly to any comparative indices or categories. Please Also Note: (1) performance results do not reflect the impact of taxes; (2) comparative benchmarks/indices may be more or less volatile than your Syntal accounts; and, (3) a description of each comparative benchmark/index is available upon request.